Technical analysis by SOAM_PRO_TRADER about Symbol TSLAX: Buy recommendation (9/10/2025)

SOAM_PRO_TRADER
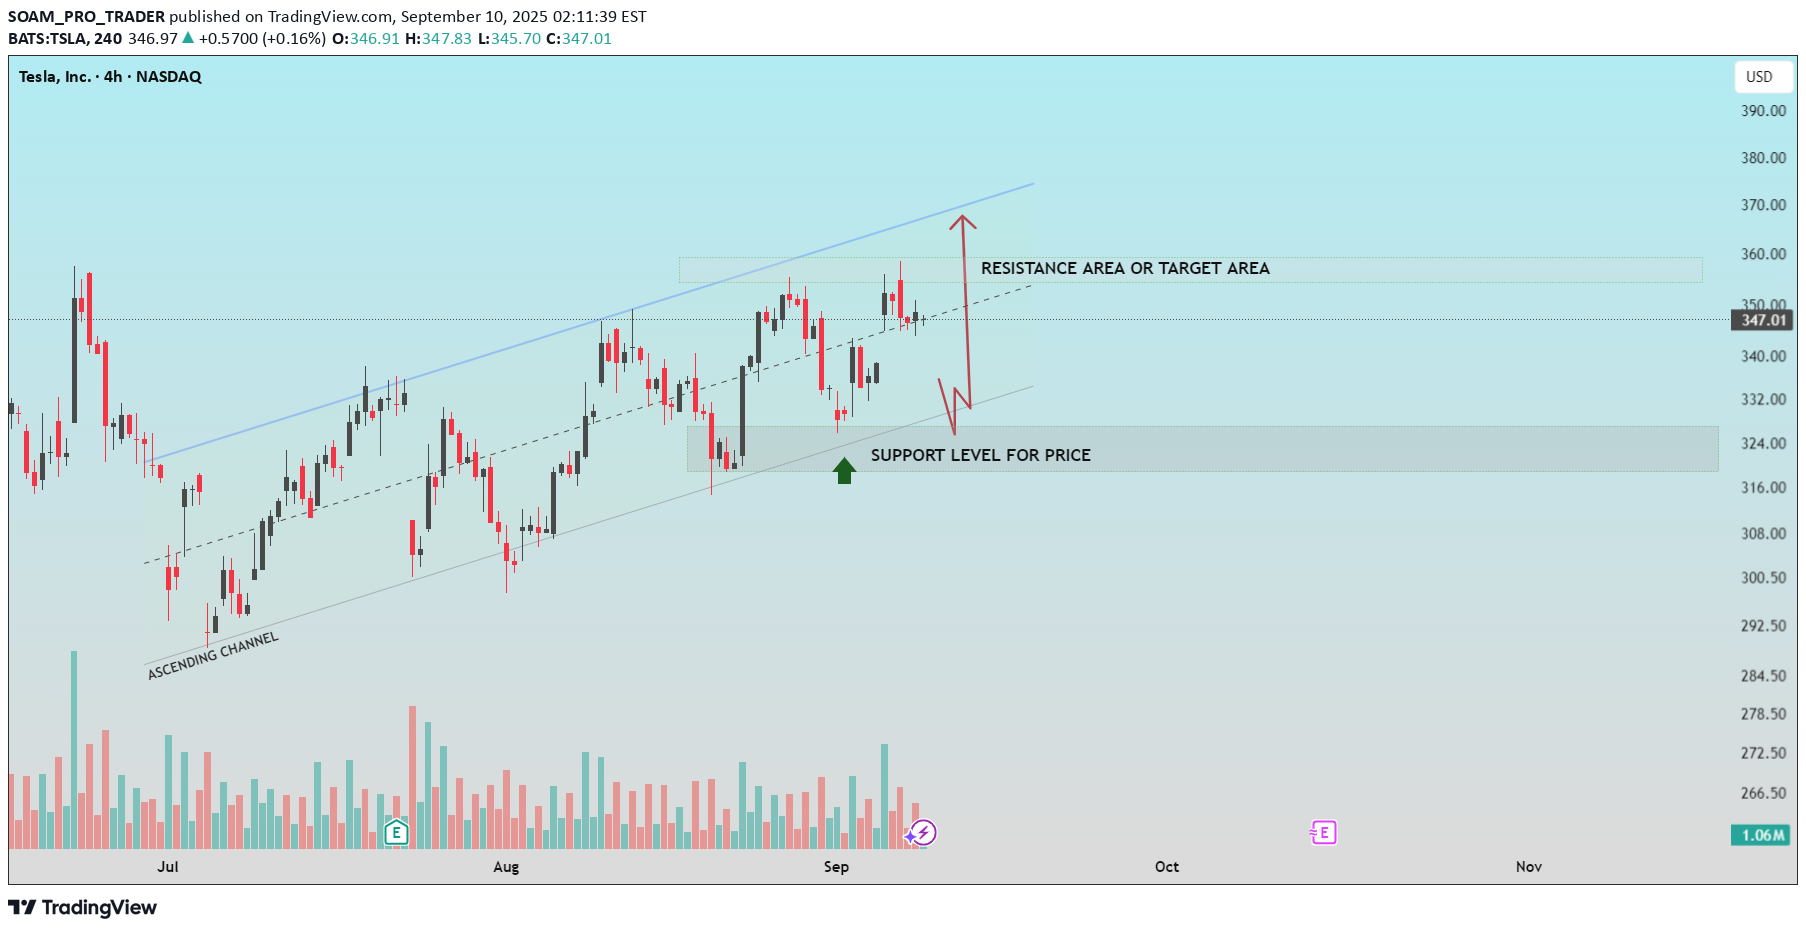
Technical Analysis Of Tesla Inc. (TSLA) Chart Pattern: Ascending Channel TSLA is trading within a well-defined ascending channel, characterized by higher highs and higher lows. This indicates a medium-term bullish trend. Resistance Area / Target Zone: $355 – $360 The upper boundary of the channel aligns with a key resistance/target area. Price has tested this region multiple times, and it may act as a short-term ceiling unless bullish momentum strengthens. Support Zone: $320 – $325 The lower boundary of the ascending channel and recent price reactions around $324 suggest a strong support zone. A breakdown below this level could trigger further downside. Price Projection: * Bullish Scenario: A break above the $360 level may lead to a sharp continuation toward $370+. * Bearish Scenario: Rejection at resistance could push the price back to the $320 support, with potential for a bounce or further breakdown. Volume Observation: Volume remains moderate, with no significant spikes indicating strong accumulation or distribution. A breakout or breakdown with increased volume would provide confirmation of the next move. Conclusion: TSLA remains bullish within its ascending channel. Traders should monitor the resistance zone near $360 and support near $320 for potential breakout or reversal opportunities. Support Me, For More Insightful Analysis.
