Technical analysis by SOAM_PRO_TRADER about Symbol PAXG: Buy recommendation (9/10/2025)

SOAM_PRO_TRADER
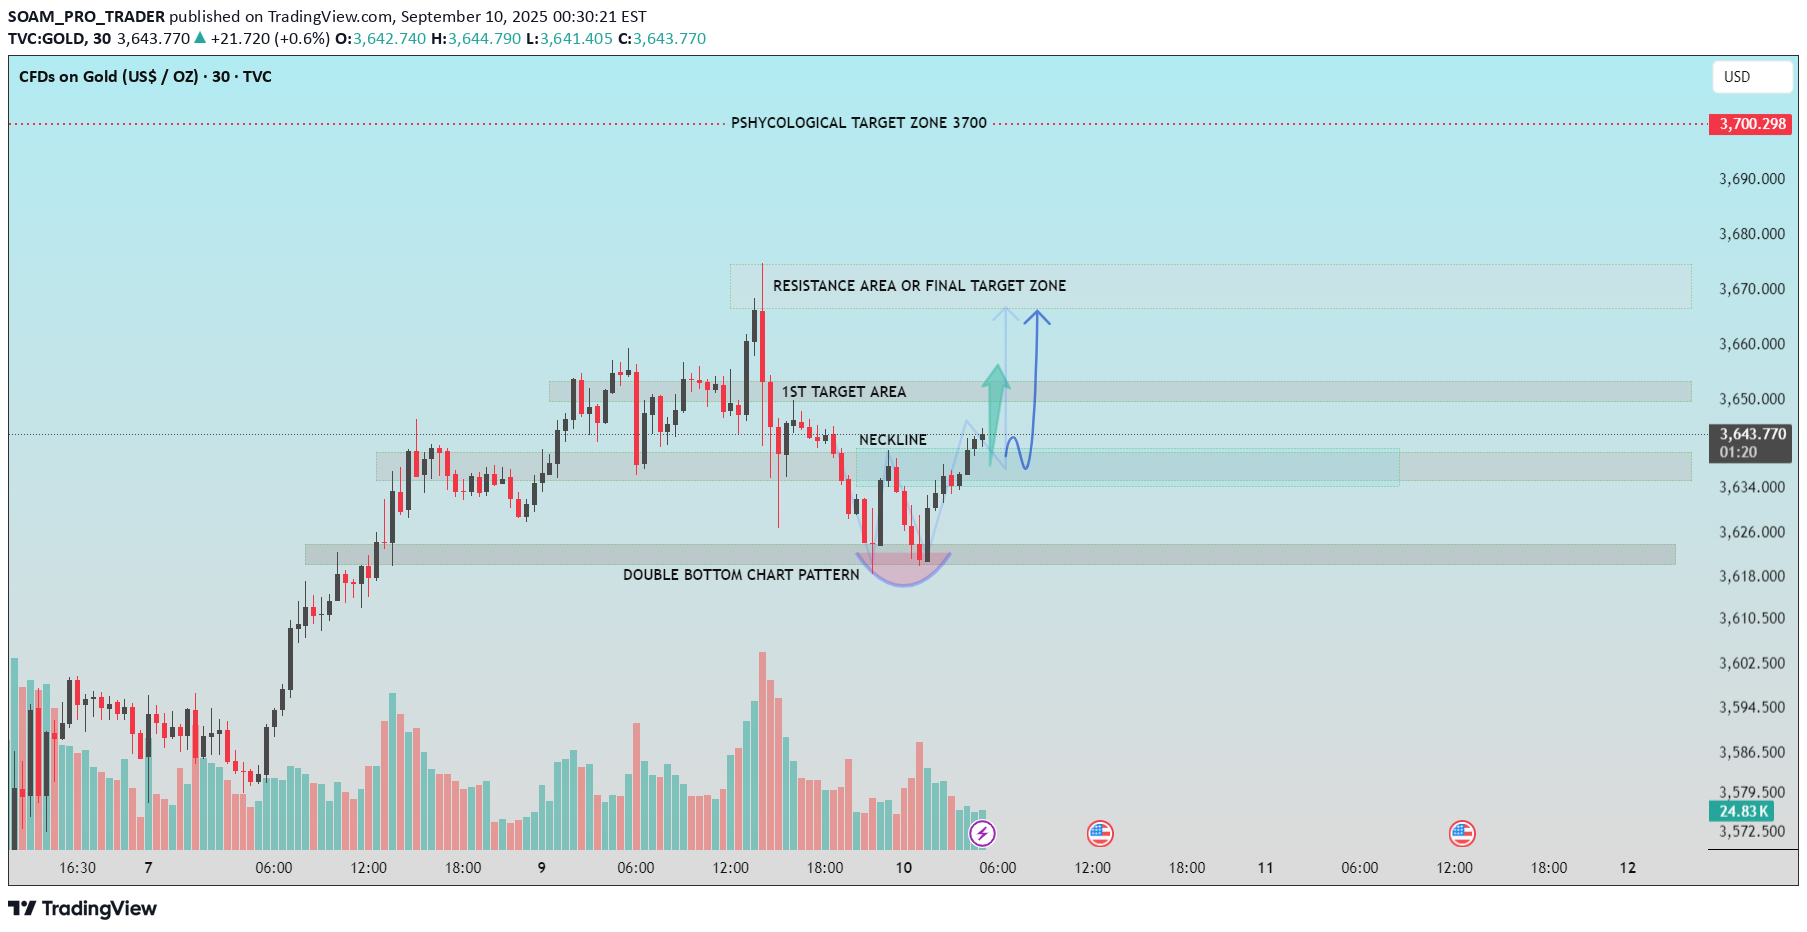
Gold (XAU/USD) Technical Analysis – 30-Minute Chart The chart shows a clear Double Bottom chart pattern near the $3,618–$3,620 support zone, indicating potential bullish reversal. This is a classic bullish pattern, often signaling the end of a downtrend and beginning of an upward move. ▪️Neckline Breakout The neckline of the double bottom has been successfully broken around the $3,638 level, confirming the pattern. Price has retested the neckline and is now attempting to move higher. ▪️Key Target Zones 1st Target Area: $3,648–$3,652 Price is approaching the first resistance zone, which may act as short-term resistance. Final Target / Resistance Zone: $3,668–$3,675 A breakout above the first target may drive price toward the final resistance zone. ▪️Psychological Target Zone: $3,700 This remains a significant psychological level and long-term bullish target if momentum continues. ▪️Volume Analysis Volume increased notably during the formation and breakout of the double bottom, adding strength to the bullish reversal signal. ▪️Outlook As long as price holds above the neckline support (~$3,638), the bullish scenario remains valid with potential targets of $3,652 and $3,675. Failure to hold above the neckline may invalidate the pattern. If this helpful for you, press the like button.from 3640, after breakout & retest of double bottom .1st target achieved,the one more layer was added from 3616, with sl 3610 & it's going 400 pips+ .
