Technical analysis by Nabi_Gunduz about Symbol BTC on 9/9/2025

Nabi_Gunduz
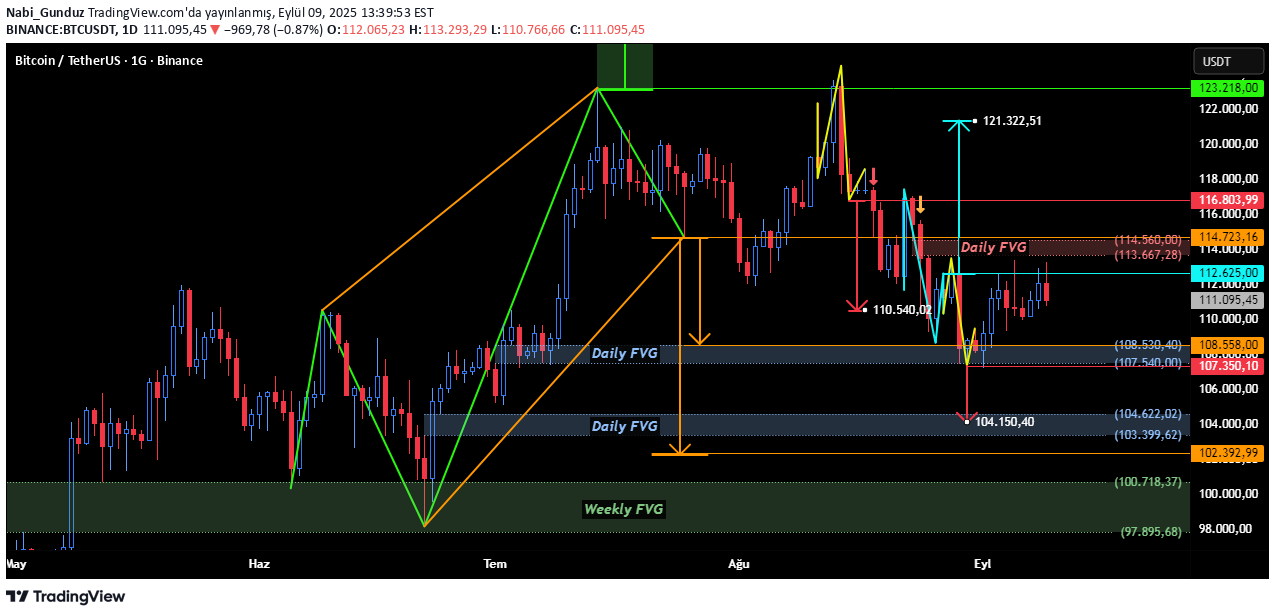
1-) Formation and levels indicated with green and orange color in the weekly time period, blue and red levels are in the daily time period ... 2-) Since the graphic is in the daily time period, the weekly decrease formation, which is seen with orange color, has been seen under 114723 candle closures, but the weekly wax closure has produced a signal with a candle closing on Sunday, August 24 and the price has reached its semi-target in the following days. Formation is considered to have worked when they reach half of their main targets. If the formation wants to go to its main target, the main target of the formation is 102393. 3-) The first decrease formation with red color produced a signal with the closing of the daily candle for 18 August and reached 110540, the main target on 7 processing days ... 4-) In addition to an active Sell signal that has reached its semi-target in the weekly time period and is expected to go to its main target, there is a new decline formation with a daily candle closing that may be below 107350 ... 5-) There is a rise formation that will produce a purchase signal with a daily candle closure that may be over 112625. 6-) The price stuck between 2 FVG regions daily, which of these two regions breaks, can continue to move in that direction ... 7-) In the longer term, the weekly FVG region specified in the graph is an important support zone and the downward frustration of this region can cause serious decreases ...
