Technical analysis by TradingShot about Symbol NVDAX: Buy recommendation (9/8/2025)

TradingShot
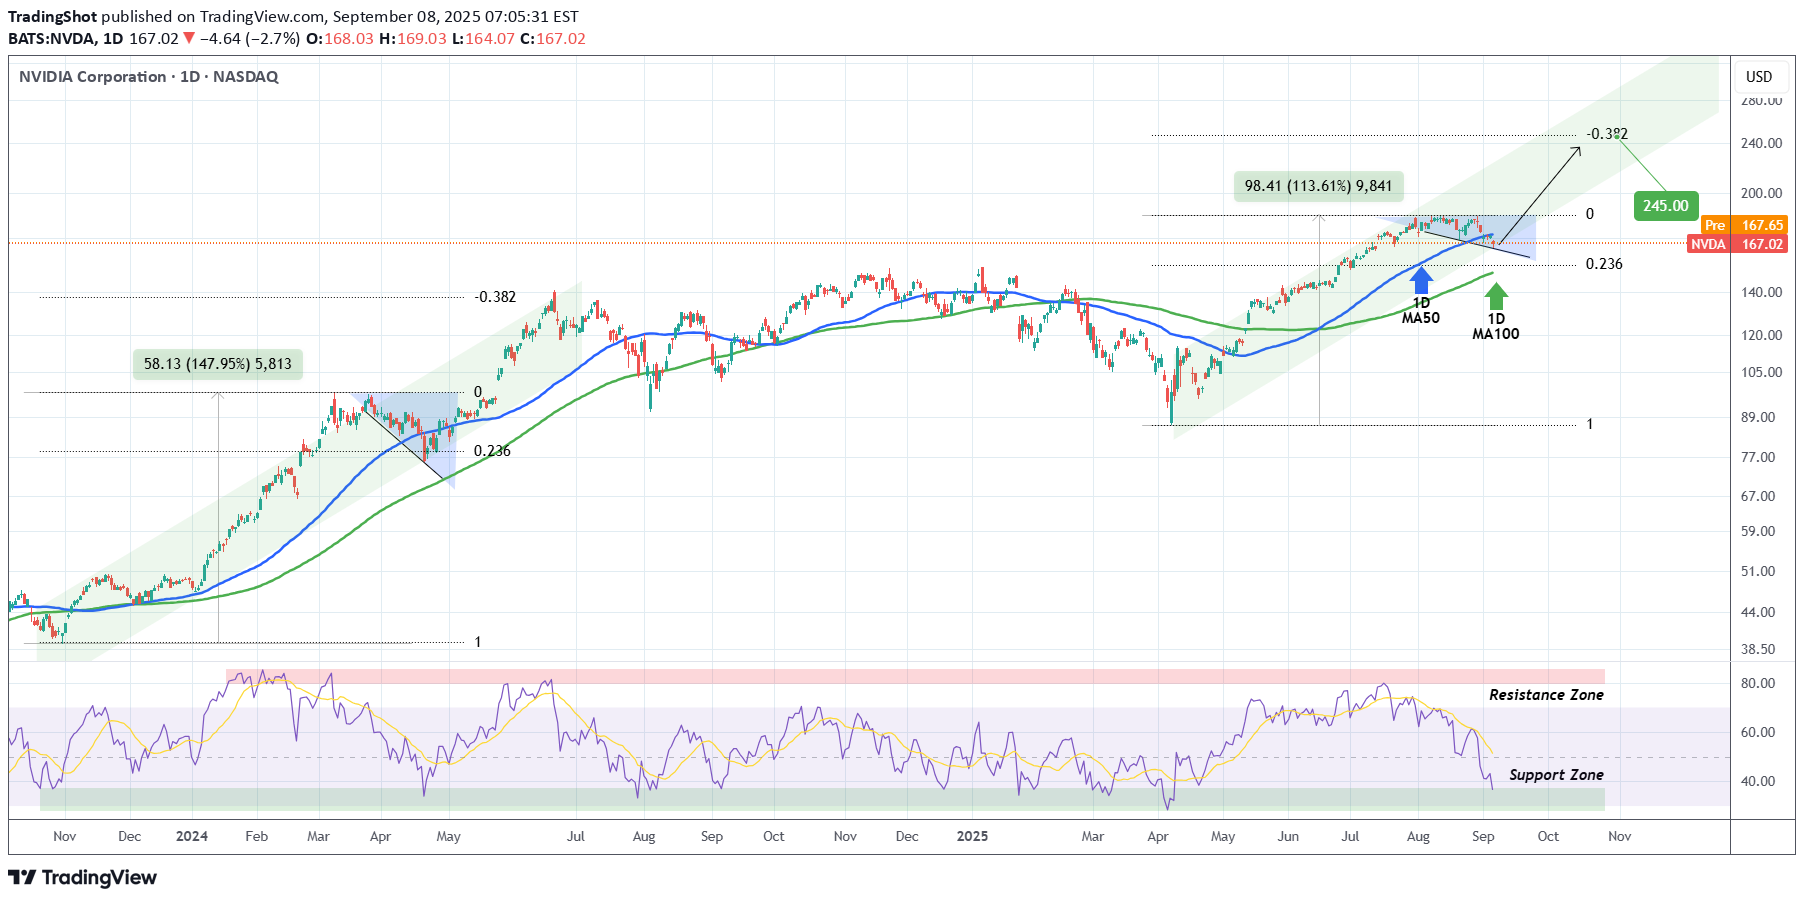
NVIDIA Corporation (NVDA) broke last week below its 1D MA50 (blue trend-line) for the first time in 4 months (since May 06). That was perceived as the bullish trend's strongest Support and rightfully so technically. The next level to watch as a Support is the 1D MA100 (green trend-line), which was the level that held and led the stock to its previous peak during the last strong bullish trend of October 31 2023 to June 20 2024. As you can see, there was a situation similar to today's where the price again broke below the 1D MA50 during the uptrend but kept the 1D MA100 intact and rebounded. Still, it managed to touch the 0.236 Fibonacci retracement level. As a result, there might be potential for one more weekly Leg down to $155.00 (Fib 0.236) before recovering but this would also most likely mean breaking below the 1D MA100. This is doubtful but not impossible but still there are higher probabilities of a rebound sooner. A strong indicator that is in Support of this is the 1D RSI, which just touched its 2-year Support Zone, a level that has always been a 'Buy' whether short or long-term. As far as a Target is concerned, the 2024 Channel Up peaked on the -0.382 Fibonacci extension, which is at $245.00. ------------------------------------------------------------------------------- ** Please LIKE 👍, FOLLOW ✅, SHARE 🙌 and COMMENT ✍ if you enjoy this idea! Also share your ideas and charts in the comments section below! This is best way to keep it relevant, support us, keep the content here free and allow the idea to reach as many people as possible. ** ------------------------------------------------------------------------------- 💸💸💸💸💸💸 👇 👇 👇 👇 👇 👇
