Technical analysis by Nabi_Gunduz about Symbol PAXG on 9/7/2025

Nabi_Gunduz
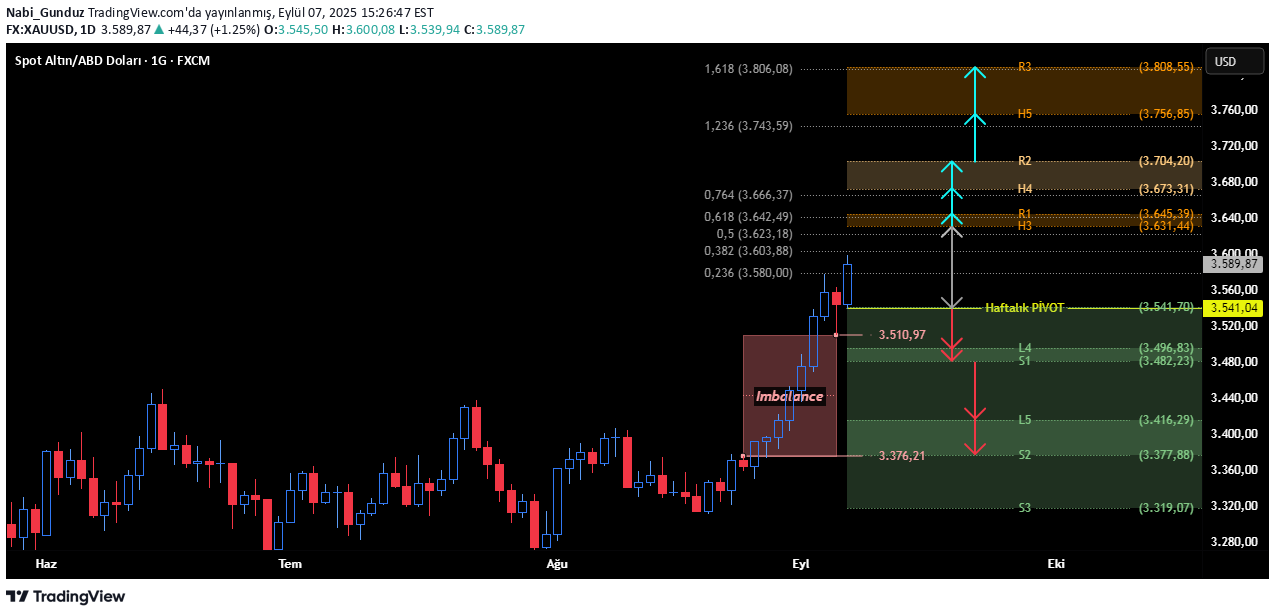
Hello, P.tesi Daily Pivot: 3575.27 Weekly Pivot: 3541.04 It is not technically correct in terms of 4 -hour candle closure under 3575.27 for the P. Stepi day without a 4 -hour candle closure next week without a daily candle closure under 2541.04 ... You see weekly mathematical values in the graph. It continues positive appearance for the price on the daily and weekly pivot. Considering that H3 and L3 levels are reversal levels, retreats to the weekly Camarilla L3 level overlapping with the weekly pivot can be covered by a rise to the H3 level. In the rise that may be experienced without retreating to this region, unless there is a daily candle closure above the first orange area I have mentioned as the H3-R1 region in the graph, it is very logical to make profit realization from the buy operations when the price reaches the first orange region. The daily candle closures that may be on the regions may provide targeting the next region, as well as the daily candle closure that may be under the weekly pivot, targeting the L4-S1 zone. In the case of daily candle closure that may be under S1, the next target can be L5-S2 zone ... On the other hand, in the graph, the pink scanned region is an impaired candlestick region. It is not a random movement that the last red candle is that the spike part is that way. Therefore, if there is a daily candle closure in the gap formed by the impaired candles starting with the bottom level of that red candle, it should be noted that at least 50 %and even all of the region can be filled. Fibonacci levels that are sent with gray levels in the graph are minor levels, but each are short -range resistance. I wish you a good profitable week ...
