Technical analysis by trade1638 about Symbol ZEC on 9/7/2025

trade1638
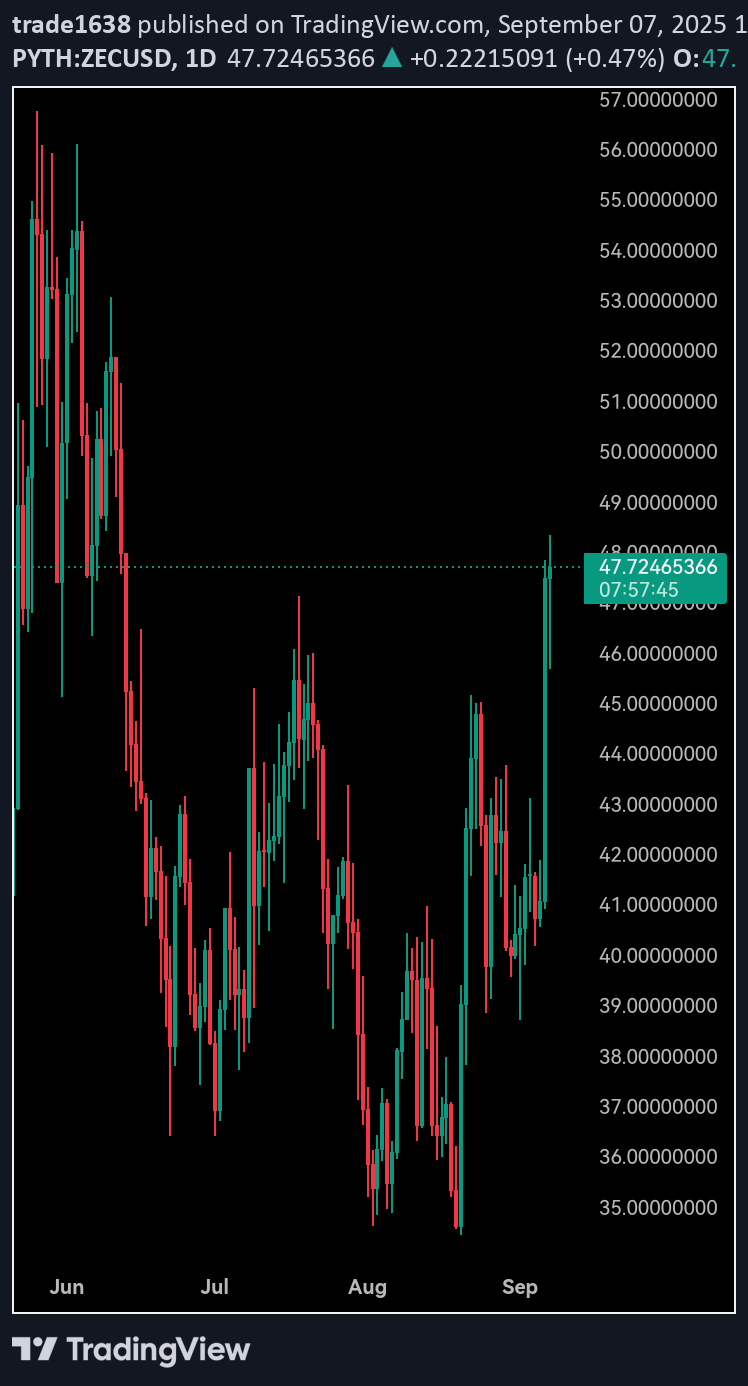
ZECUSD is testing crucial support at $22.50 after breaking below its 200-day moving average. Daily chart shows a descending triangle formation with volume declining consistently, indicating weakening bullish momentum. The next key support level awaits at $21.80, which coincides with the March 2023 low. RSI sits at 38, approaching oversold territory but not yet signaling reversal. MACD lines remain below zero with bearish divergence, though the histogram shows minor convergence, suggesting selling pressure may be moderating. Immediate resistance appears at $24.20 (previous support turned resistance), with stronger resistance at $25.80. The privacy coin sector continues facing regulatory headwinds, particularly affecting ZEC's institutional adoption prospects. Trading volume remains below average for the third consecutive week, reflecting lack of conviction. A break below $21.80 could trigger accelerated selling toward $20.00 psychological level.
