Technical analysis by pakoumal about Symbol QQQX on 9/6/2025

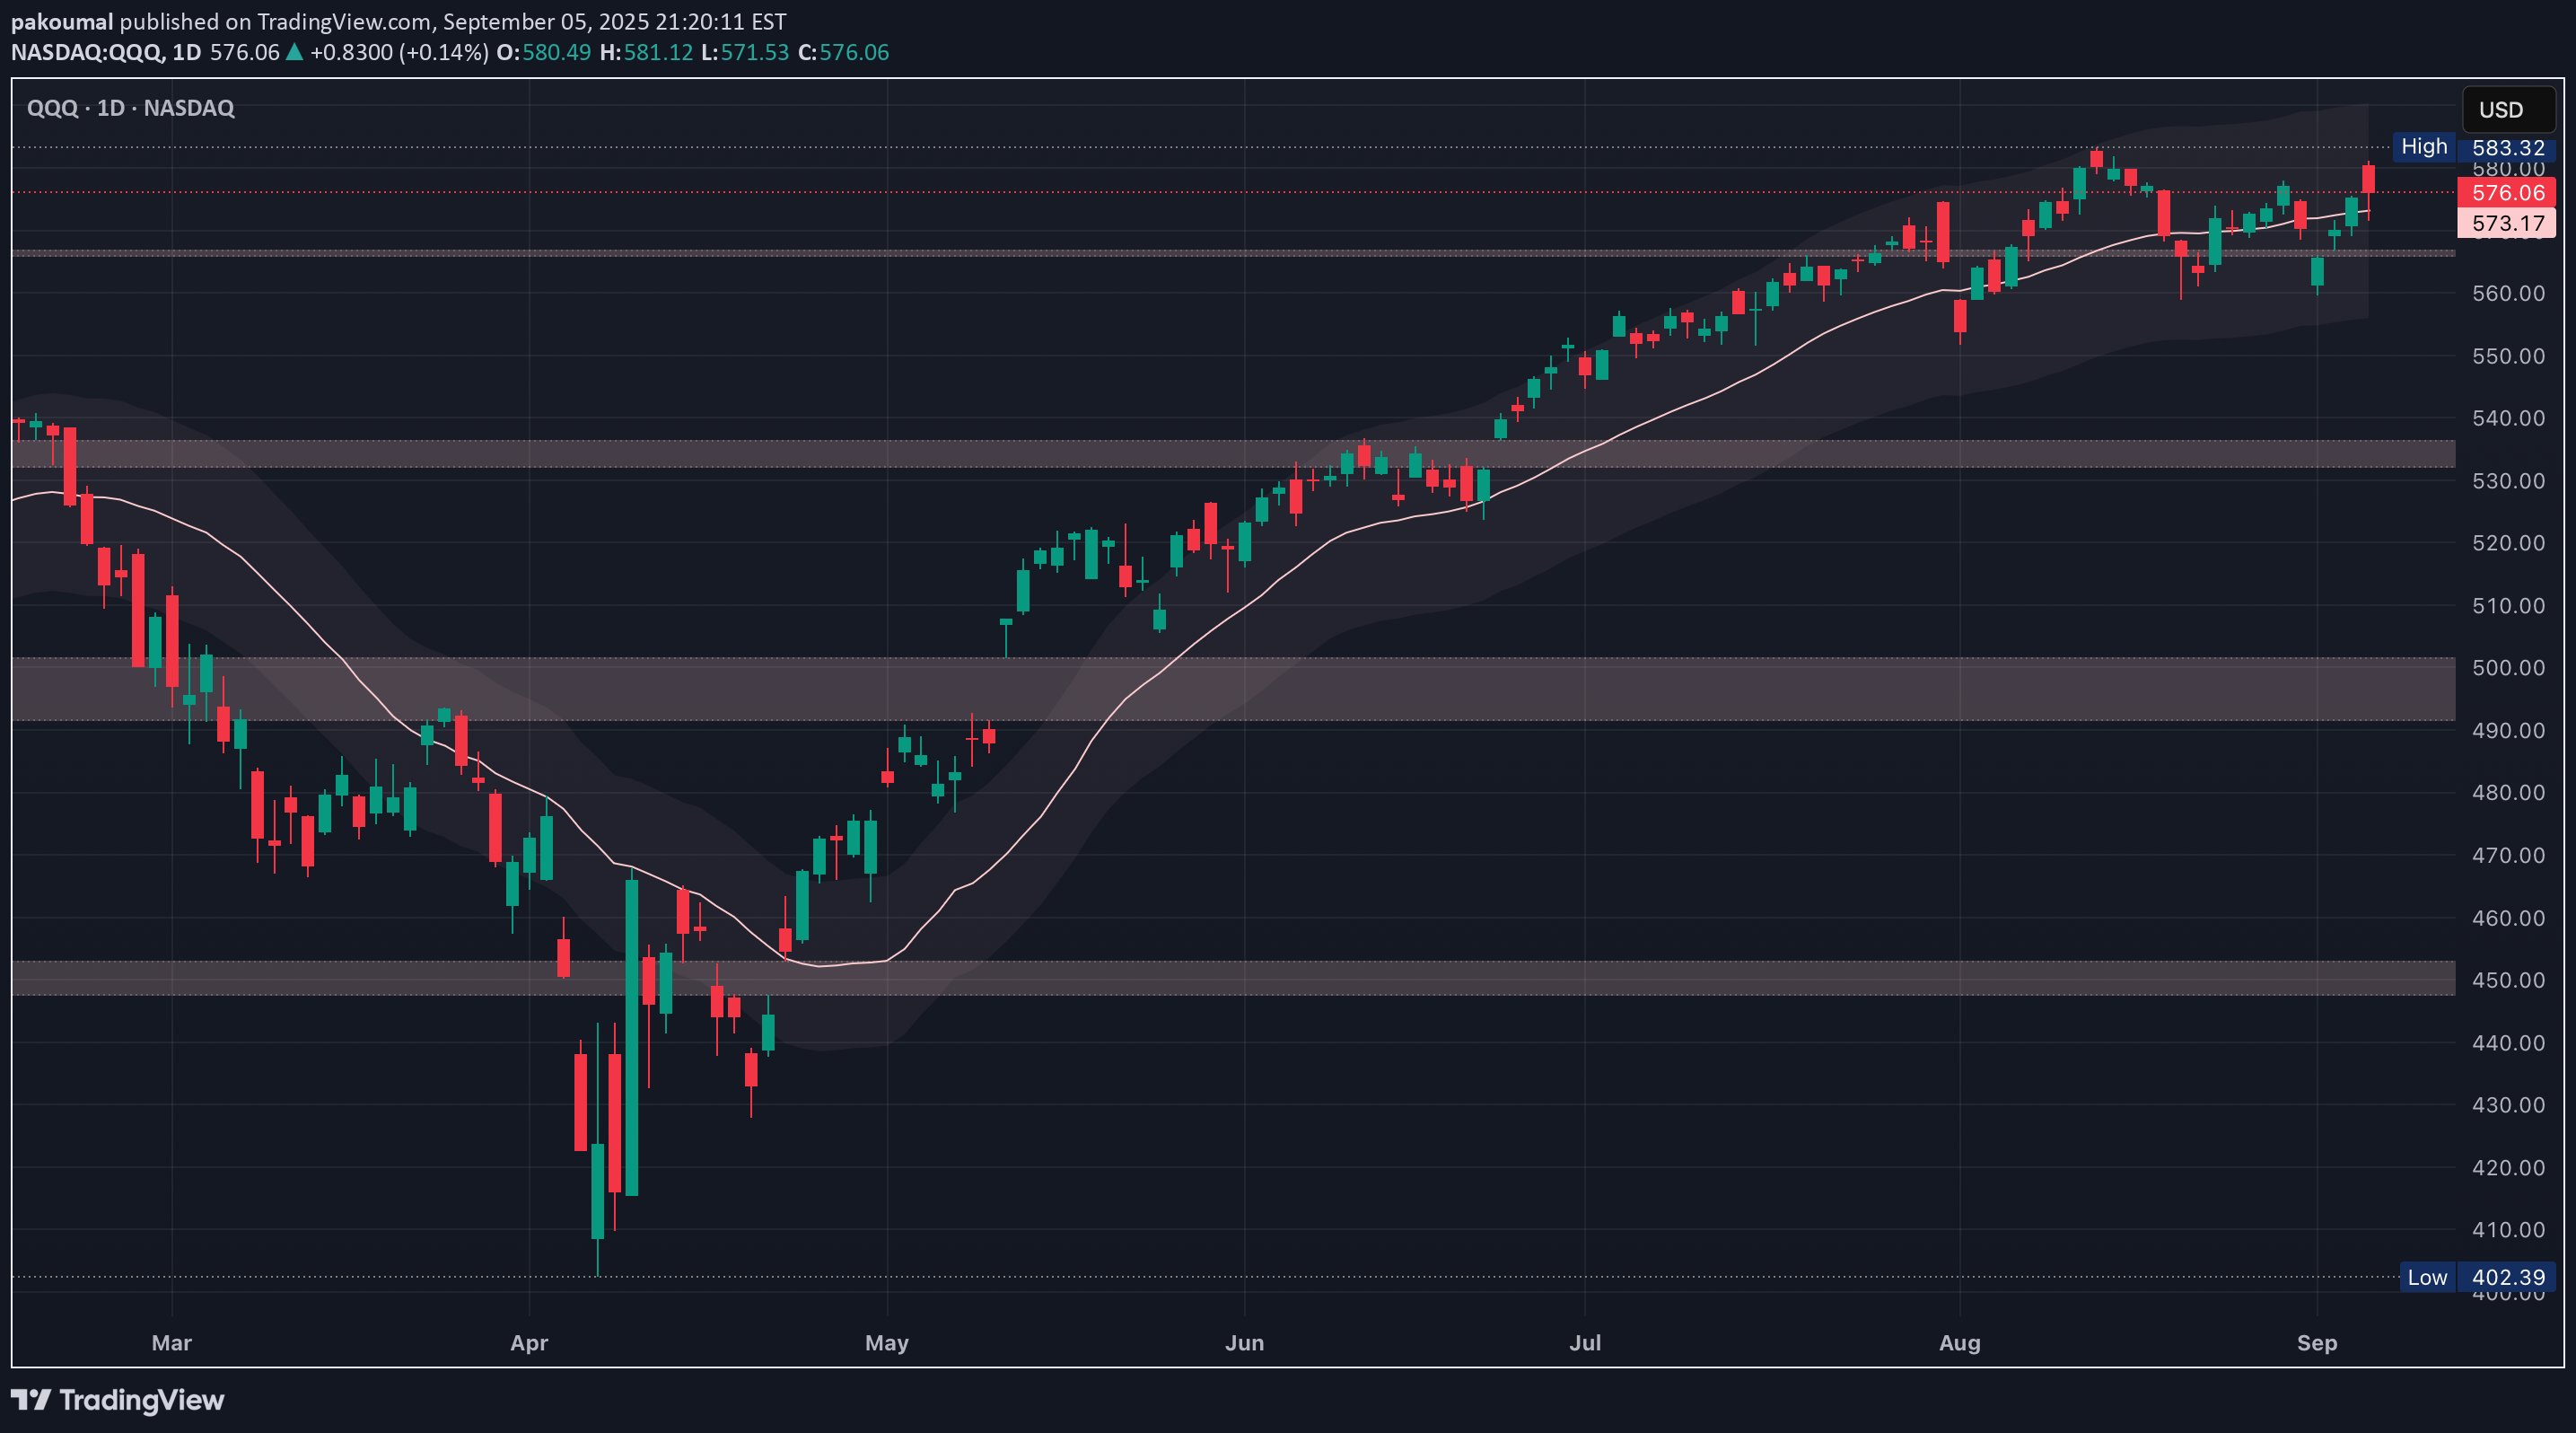
The slope of the lines matters for pattern bias Sloping slightly down from $583 to $580 Holding flat around $563–$565 That shape is actually closer to a descending triangle Bearish continuation if support breaks But here’s the nuance, Descending triangles typically form after a downtrend, as continuation QQQ is in a strong uptrend, so even if the geometry looks bearish, context says bulls still have an edge In uptrends, these patterns can fail bearishly & instead resolve higher, especially if support keeps holding So the pattern could be read 2 ways, Descending triangle with support at $563 breaks = $545–$550 A coiling consolidation under resistance, which still may resolve upward given the broader trend The key difference will be whether $563 breaks down or holds Bearish breakdown (descending triangle plays out) at 35% because the macro trend is up since April & bulls usually defend support zones first, but if $563 breaks with volume, bears gain momentum quickly Bullish breakout (uptrend prevails) at 50% because of the broader uptrend + strong dip buying since April Each rejection at $580 has been shallow, showing underlying demand Price keeps oscillating between $563–$580 for another week at 15% in the short run, but if it drags on too long, the eventual breakout becomes stronger
