Technical analysis by pakoumal about Symbol QQQX on 9/5/2025

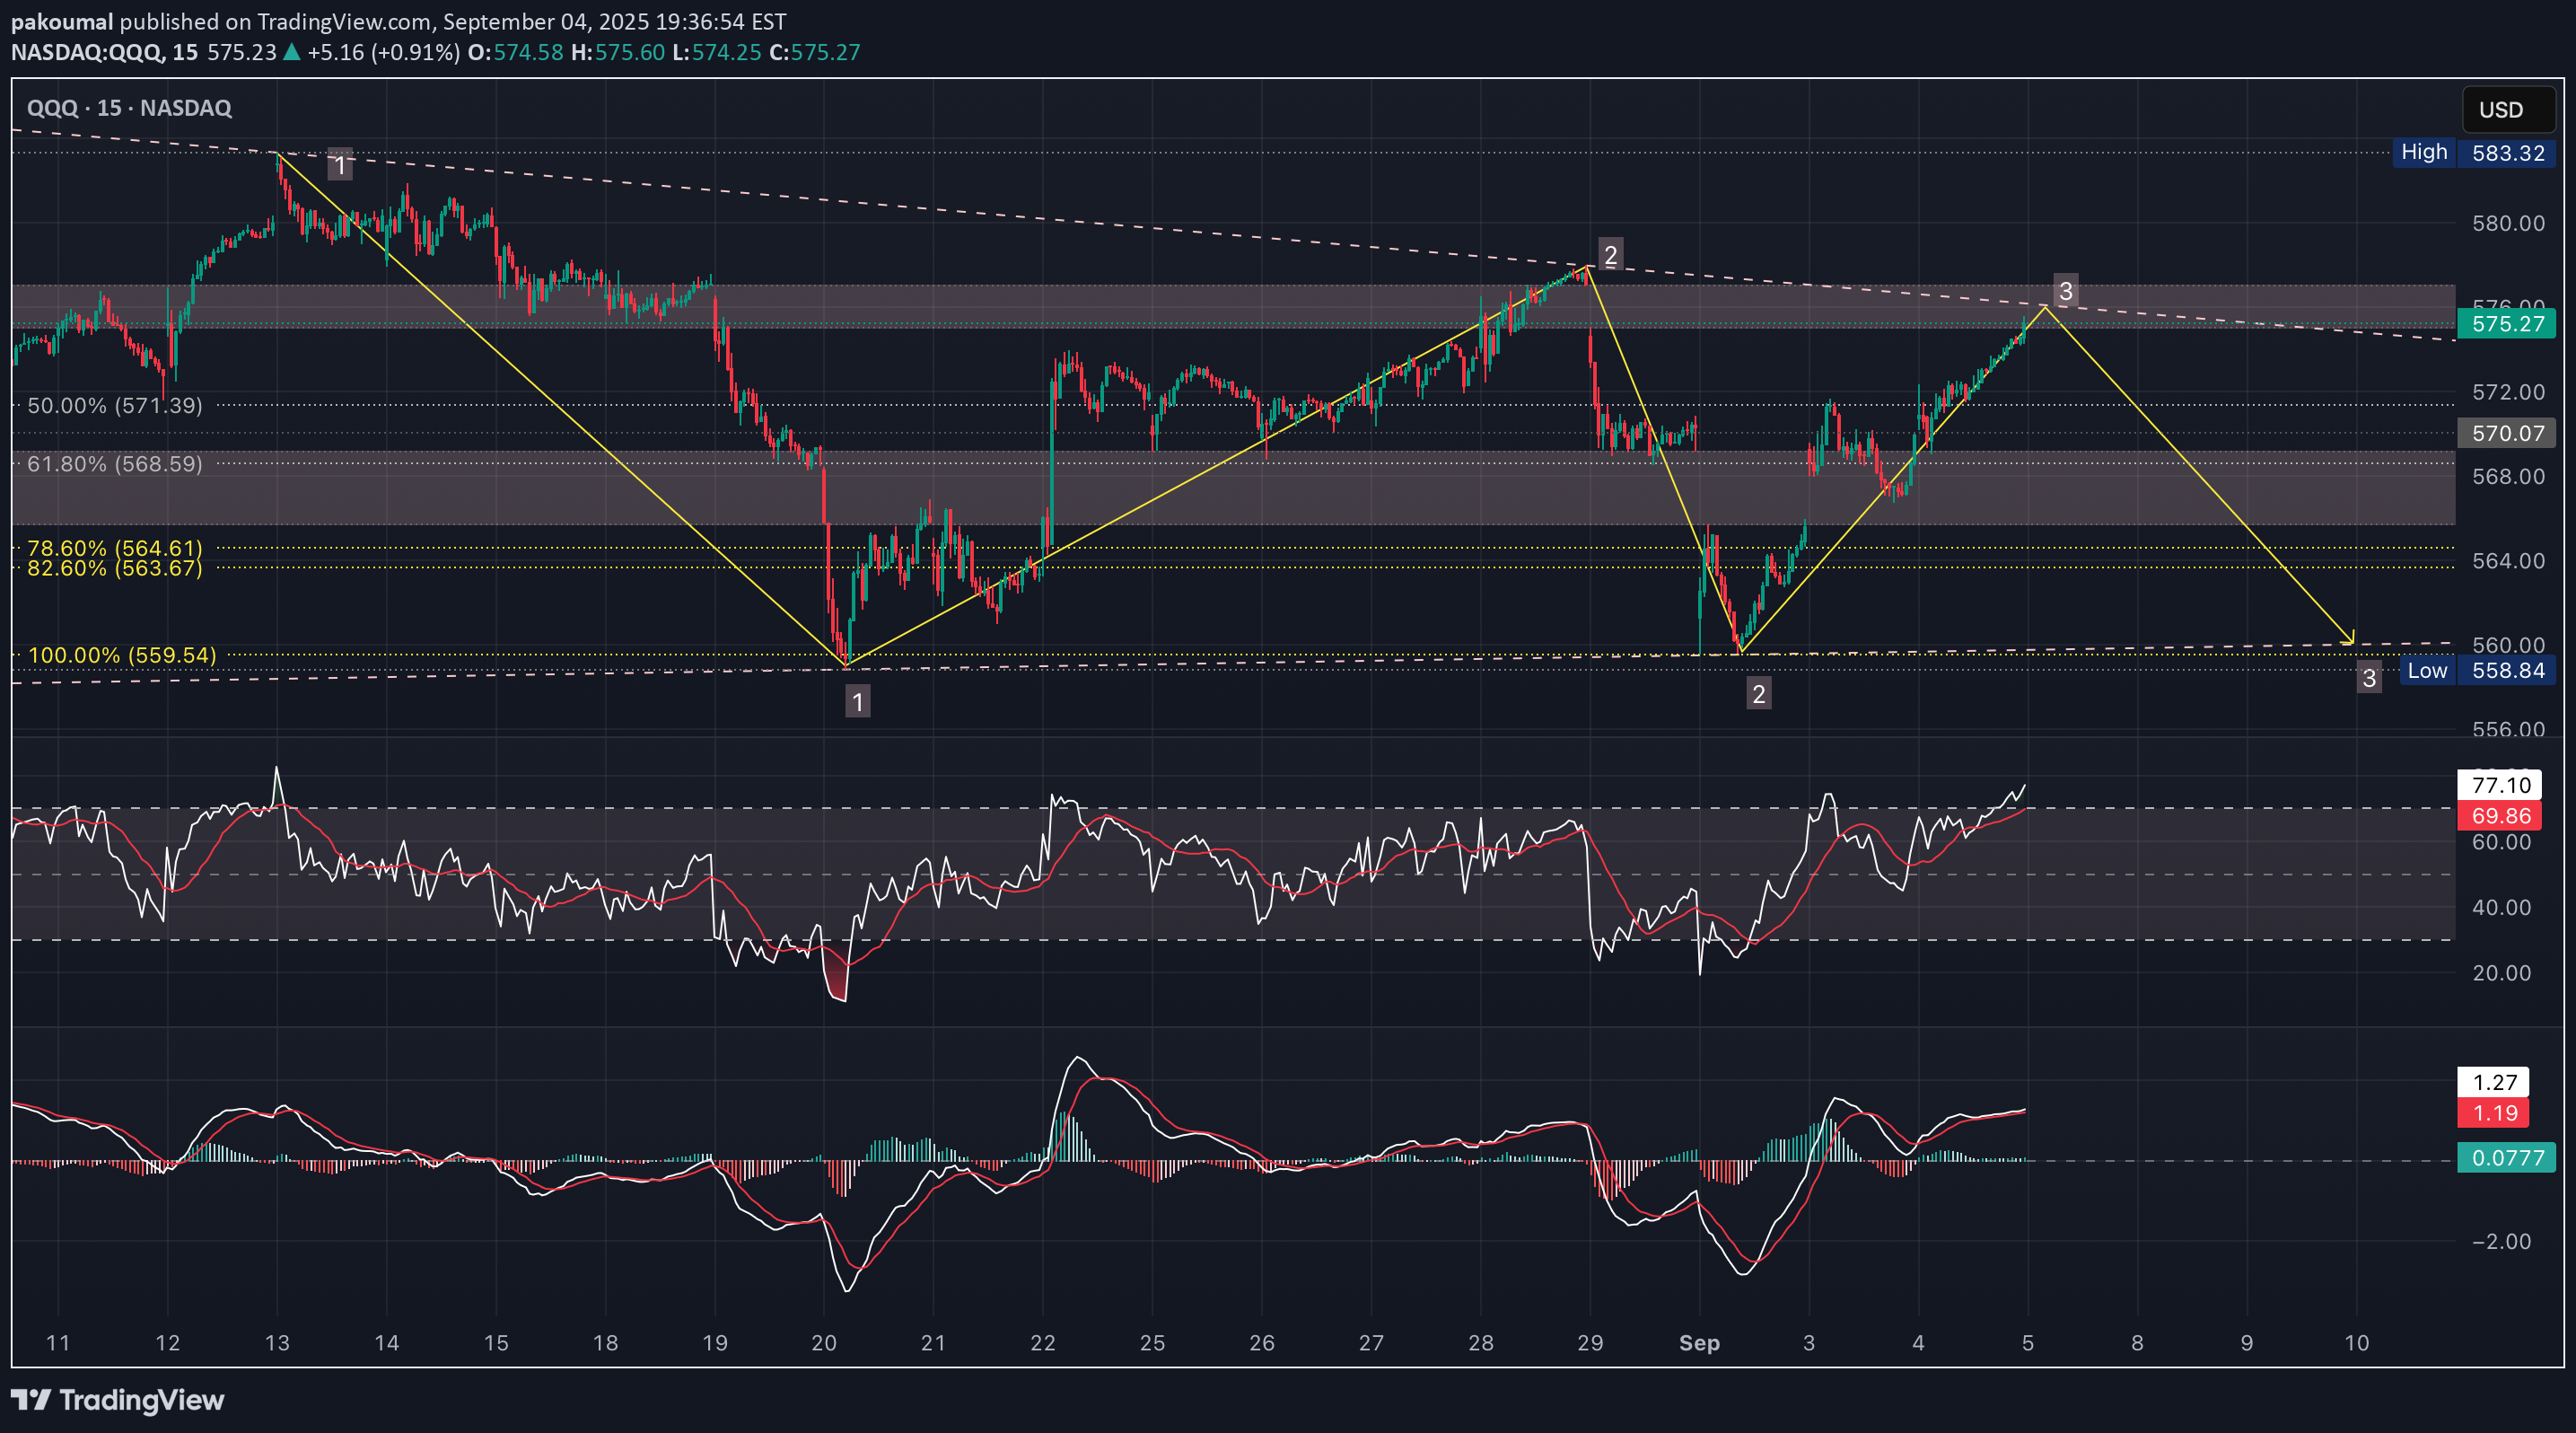
Today’s rally into resistance doesn’t cancel the bearish structure - it just tested the ceiling again, like the ball bouncing off the ceiling one more time Price bounced, yes, but it stopped right at the descending trendline and supply zone Until QQQ clears $577–$580 on volume, this is just another lower high RSI still under 60 on the daily MACD still bearish crossover Bearish setups need bounces since sellers actually want rallies into supply Today’s move just brought price back to the spot where bears previously took control The deciding factor is whether tomorrow’s NFP release causes a breakout above $580 (bullish) or a breakdown below $562 (bearish) Descending triangles usually resolve downward (break of the flat base) A clean daily close <$562 would trigger measured move targets Until $562 breaks on volume, it’s still just compression Sometimes triangles fake down, trap shorts & rip higher (especially with macro catalysts like NFP) If $576 rejects, short to $562–$558 If $577–$580 breaks (bulls win), step aside or flip long toward $583+ The Fib retracements line up neatly, 50% = $571.39 61.8% = $568.59 (sits right inside that shaded demand area) 78.6% = $564.61 & 82.6% = $563.67 (exactly where buyers defended) 100% = $559.54 This layering creates a ladder of potential supports, but also a measured path for shorts The 1, 2 & 3 path into $559–$560 matches the 100% extension of the prior move This is where measured move & Fibonacci confluence meet Bears could take profit on the way down at $568.5 to $564.5 & $560 If $559 breaks with volume, extension opens toward $547 (200d SMA) which would be the larger “unwinding” target Invalidation is simple, if daily close >$577–$580 trendline While in-play, each Fib level gives you a chance to trail stops down Trendline + Supply Zone + Symmetry + Fibonacci = high-probability short setup Price = supply zone/descending trendline RSI = overbought on the 15m & below the midline slope & capped under 60 on the daily That’s a sign of weak momentum - each bounce fizzles out earlier The RSI trendline itself is descending, which mirrors price MACD = potentially topping on the 15m & still bearish crossover on the daily with it's histogram contracting slightly, so momentum is still in bear mode, with only a weak attempt at recovery Momentum: RSI + MACD both confirm sellers are in control of the bigger picture If NFP or another catalyst sends QQQ through $577–$580, watch for RSI breaking above 60 (momentum shift) & MACD histogram flipping positive with a bullish cross That would negate the bearish triangle & turn this into a breakout squeeze toward $583+
