Technical analysis by for_forexit about Symbol PAXG: Sell recommendation (9/3/2025)
for_forexit
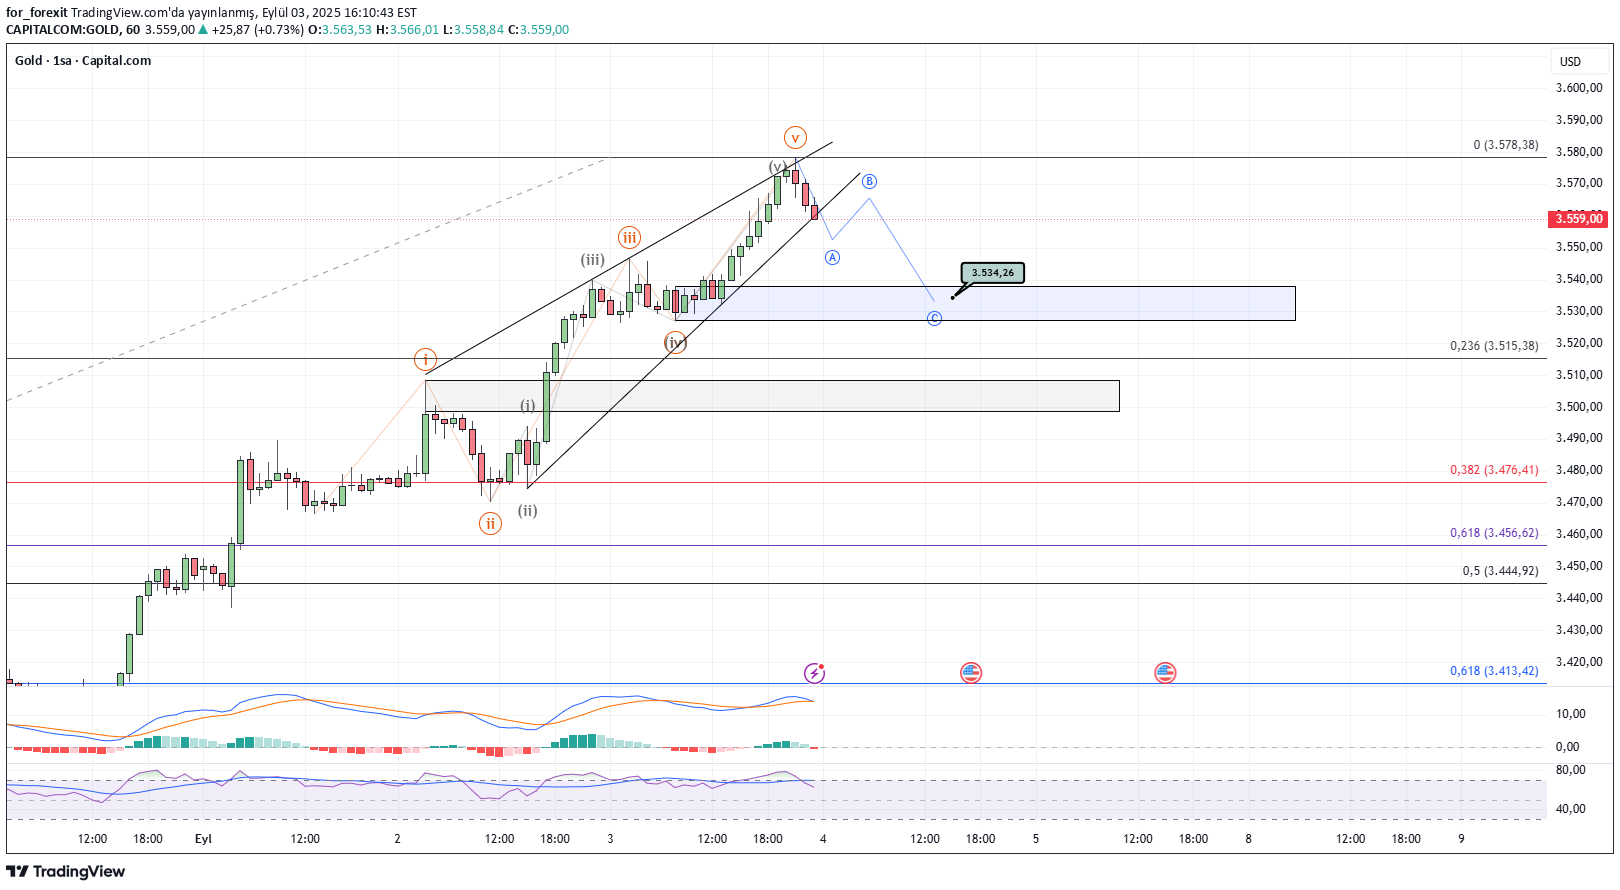
Gold, after completing the five wavy impuls (i-iii-iv-v) structure in the hourly graph, showed fatigue signs on the upper band of the ascension channel. As of now, it is traded at 3559 levels. 🔎 Technical Details that stand out: According to the wave count, ABC is expected to correct after the rise. The first support zone is between 3535 - 3515 (blue box). 📌 Scenario: In the short term, the price is directed to supports with a wave A, and then recovery with B response, Then, with the C wave, it is possible to hang to 3535 - 3515. In addition, the wedge structure it has broken gives the clue that the price is tired of the rise. ⚠️ Risk Note: This analysis is only based on technical appearance, not investment advice. Shape your transaction plan according to your risk management.
