Technical analysis by MeTraderTr about Symbol DCR on 9/3/2025

MeTraderTr
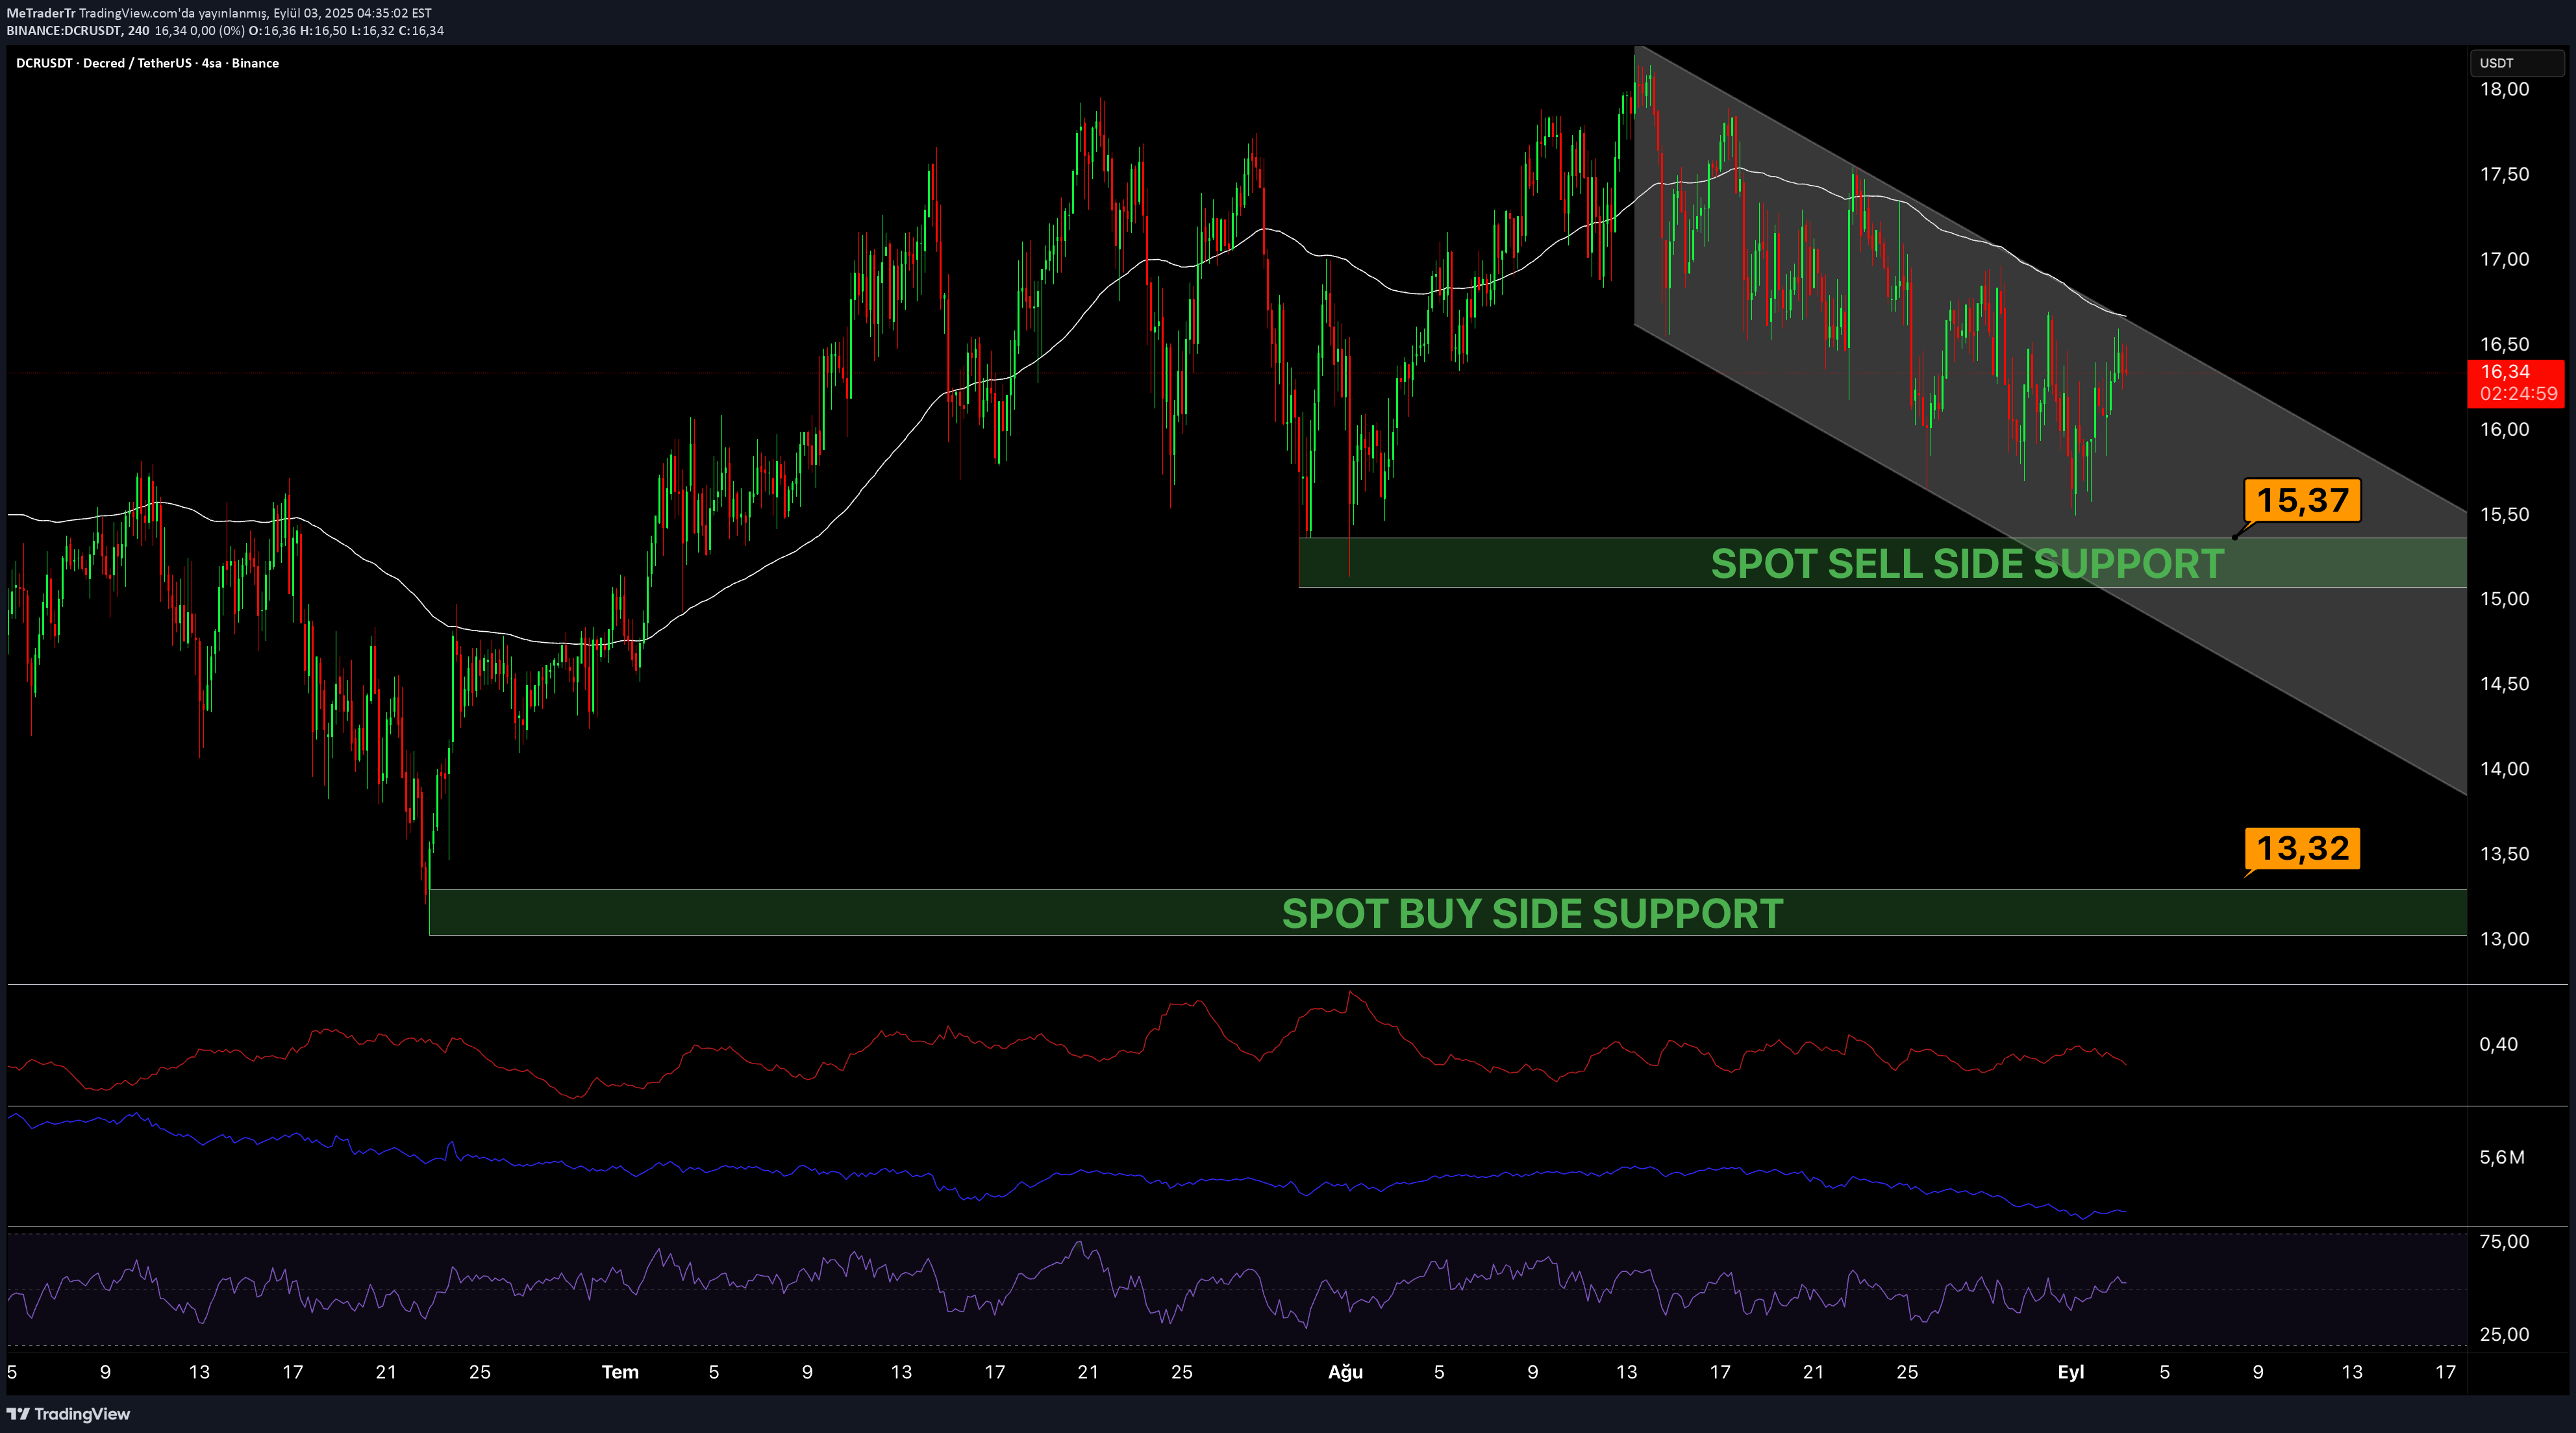
- Price Structure: The price is currently moving in Descending Channel. When the upper trend line prints, the $ 15.37 support zone is the first important level below. If this area is broken, the second strong support is on the $ 13.32 level ... - Double Exponential Moving Average): The price is moving under Dema (white line). This indicates that short -term momentum is weak, but if permanence is provided on the dema, a trend return signal can be taken ... - ATR (Average True Range): Movement is low in ATR, which shows that volatility is reduced. In other words, the likelihood of harsh breaks increases and volatility may rise after direction selection ... - RSI (Relative Strength Index): RSI is around 50 horizontal, indicating that there is no clear momentum in this market and the level of the level increases if the level increases, and if it falls below 40, the seller pressure will be strengthened ... - OBV (Ten Balance Volume): OBV shows that sales pressure is stronger than purchase pressure in the downward trend. In the rise scenario, OBV must recover ... ✅ General; - Rise scenario: If the price holds over $ 15.37 and breaks Dema, the rise guarantee ... - The fall scenario: $ 13.32 works as a strong support zone at closing under $ 15.37 because this region is the place where buyers can concentrate in terms of liquidity ... #Metrader #DCR #spot #crypto #trading
