Technical analysis by DefiWolf about Symbol MOCA: Buy recommendation (9/2/2025)

DefiWolf
MOCA Trade Setup – Eyeing 0.16–0.17 Target Zone
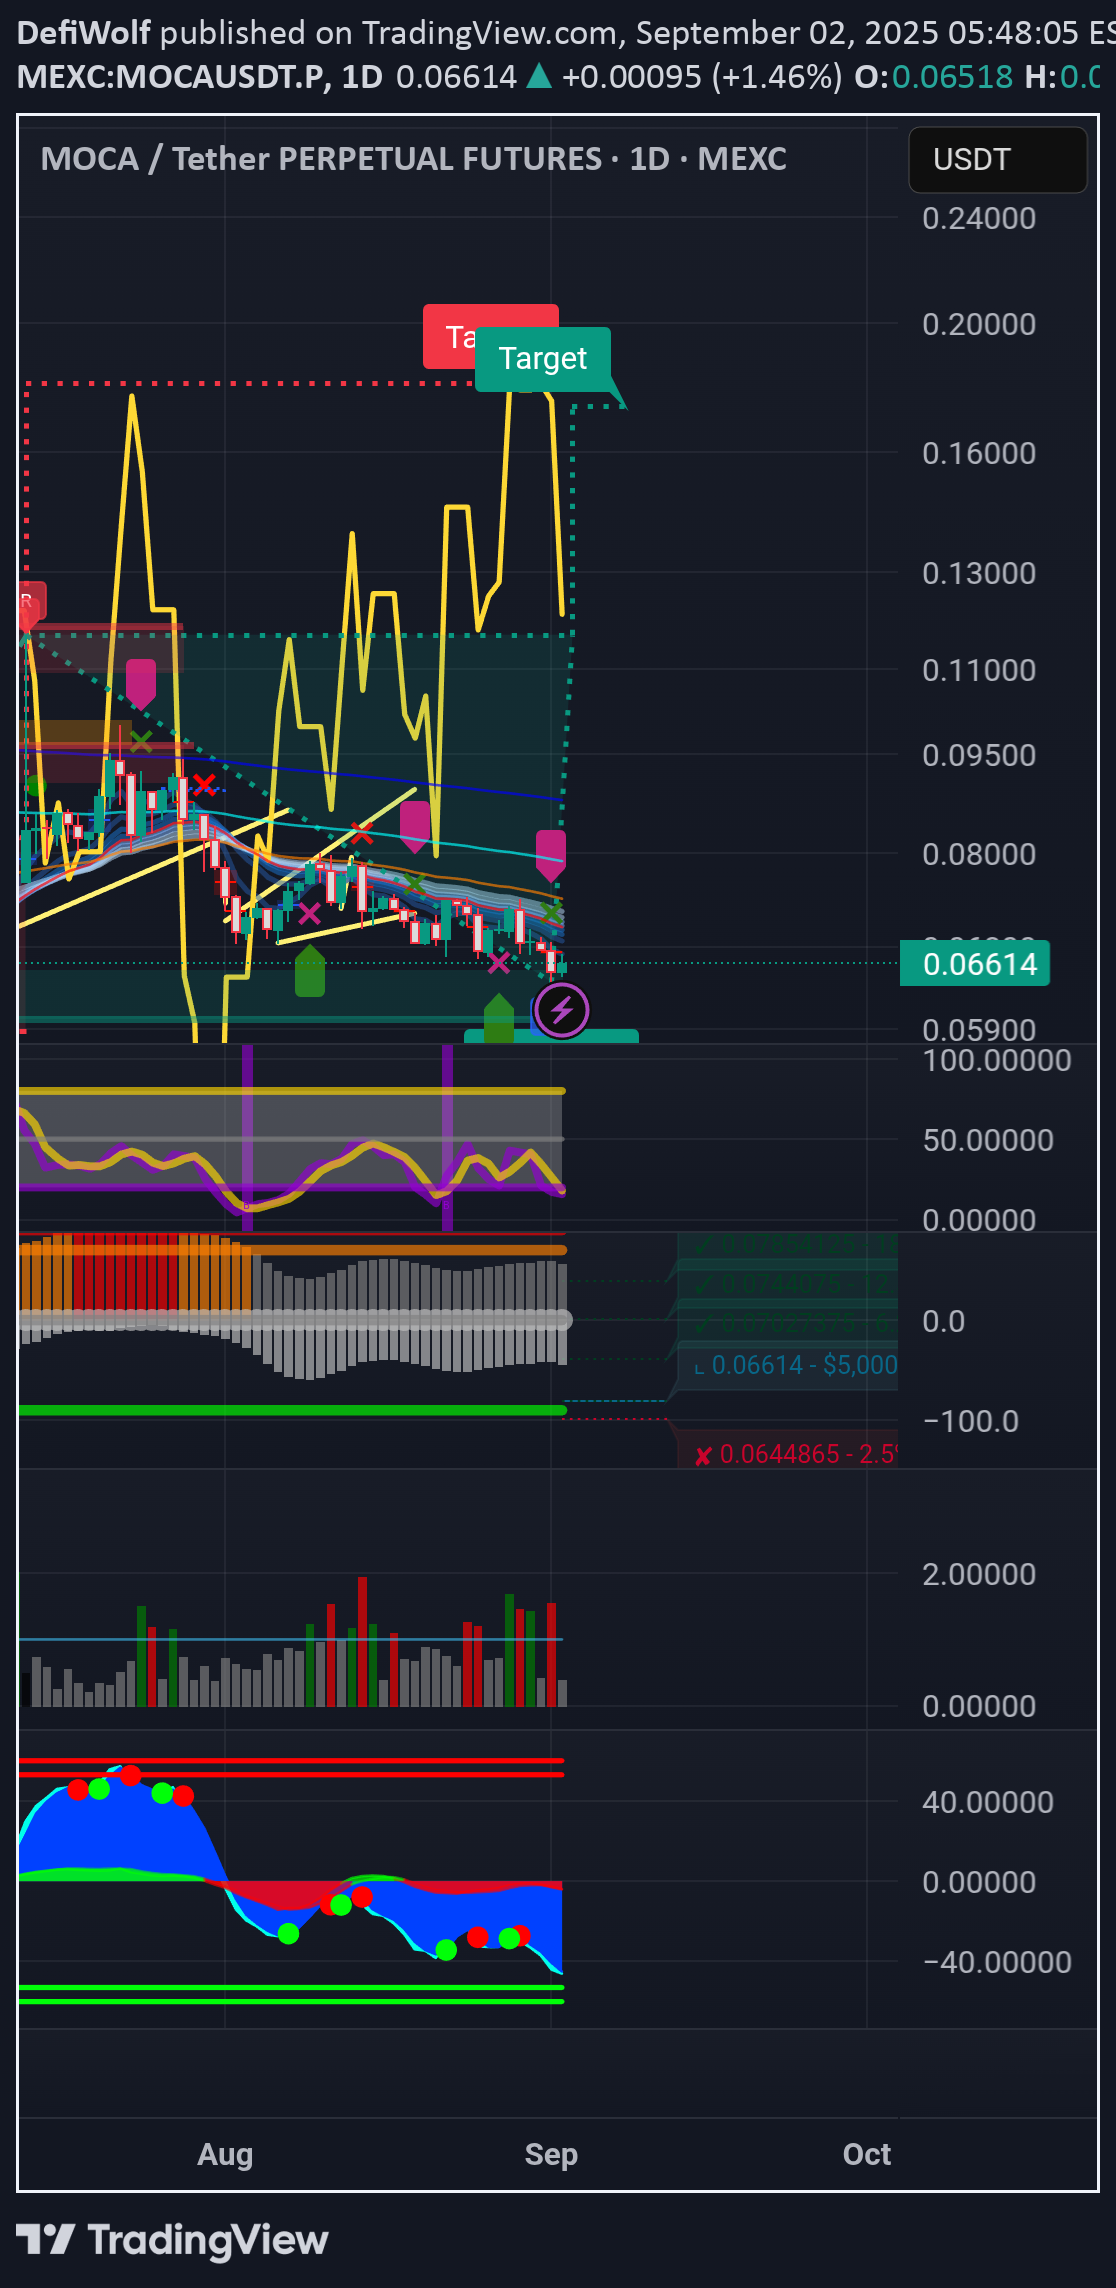
Looking at the MOCA/USDT perpetual futures daily chart, the structure is setting up for a potential mid-term move that could surprise many who are still focused on the current range. 🔍 Technical Breakdown 1. Support & Accumulation Zone Price is stabilizing around $0.066, with strong accumulation signs visible on volume. The lower wicks around $0.064–0.066 suggest buyers are stepping in to defend this zone. 2. Indicators Flashing Reversal Stoch RSI is curling from oversold territory, often a precursor to explosive moves. Momentum oscillators are showing bullish divergence while price consolidates at support. Daily histogram and wave indicators are flattening, signaling exhaustion of sellers. 3. Key Levels to Watch Immediate resistance: $0.075–0.09 (short-term squeeze zone). Mid-range target: $0.11–0.13 (historical supply). Major target: $0.16–0.17 (measured move projection and prior resistance cluster). 📈 Bullish Scenario If MOCA can close decisively above the $0.075–0.08 range, momentum traders and algos could drive a breakout towards the $0.11–0.13 area. Once above $0.13, the path opens to the 0.16–0.17 macro target zone, representing more than 2.5x upside from current levels. ⚠️ Risk Management Invalidated if MOCA breaks and holds below $0.064 support. Leverage traders should watch funding rates, as sudden spikes may signal overcrowding. Scaling out profits at 0.11, 0.13, and final target 0.16–0.17 is prudent. 🧭 Final Take MOCA is at a pivotal point: accumulation near lows with technicals favoring a bullish reversal. Patience will be key, but if momentum shifts, this setup has the potential to ride a strong wave up to 0.16–0.17 in the coming sessions.