Technical analysis by Nabi_Gunduz about Symbol ADA on 8/29/2025

Nabi_Gunduz
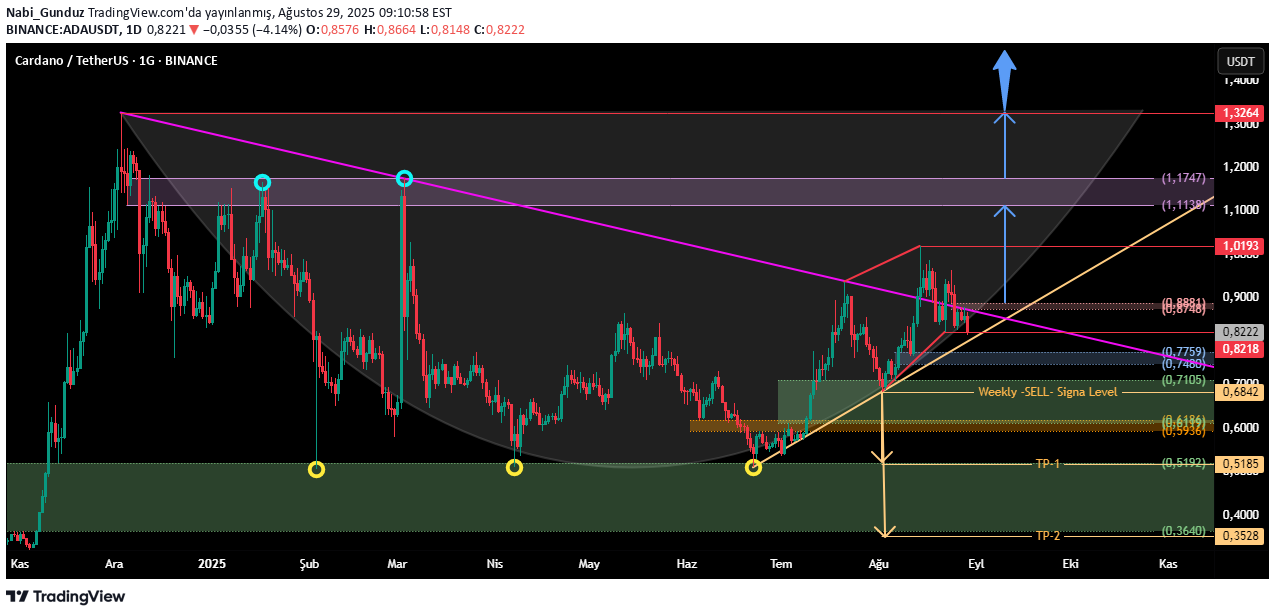
The regions seen with green color in the graph are the rising FVG regions formed in the weekly time period and the region seen with orange color is the falling FVG region formed in the weekly time period. After the weekly candle -closing area on the orange area, the region turned into reverse FVG (IFVG) region and thus the first buying opportunity was arranged. Therefore, this region is a strong support zone in the weekly time period. Another strong support level for the price that faces reaction 3 times at the upper level of the weekly FVG region, which is seen with a green color range with a range of 0.5192-0.3640, is this level (shown with yellow small apartments). On the other hand, the fVG, which is rising in the daily time period with blue color, is the FVG regions that fall in the daily time period if the dar range is seen with pink color. The daily candle closure, which may be over 0.8881, the upper limit of the FVG region, which is seen with pink color for now, can trigger the price rise again. The daily candle closure, which may be below the 0.8218 level specified with the red horizontal line, may cause the price to fall slightly, but the weekly candle closure that may be below the 0.6842 level specified with the cream -colored horizontal line may cause deepening of the decrease. This level should be followed carefully as the downward breakage of this level will also mean a market breakdown in daily time period. Another point is; The descending trend line, which is seen with pink color, has been broken upward on a weekly basis and has not yet had a weekly candle closure below. If the price can close the week on this trend line again, the completion process of the graph in the graph will resume. In this process, the first level in which the price can be listened to can be a lilac-colored area with a range of 1,1138-1.1747, which has faced sales twice before. Conclusion: 0.6842 The grocery structure in the medium term unless it is broken downward shows that the rise of the rise can continue ...
