Technical analysis by EA_GOLD_MAN_COPY_TRADE about Symbol PAXG: Sell recommendation (8/29/2025)

EA_GOLD_MAN_COPY_TRADE
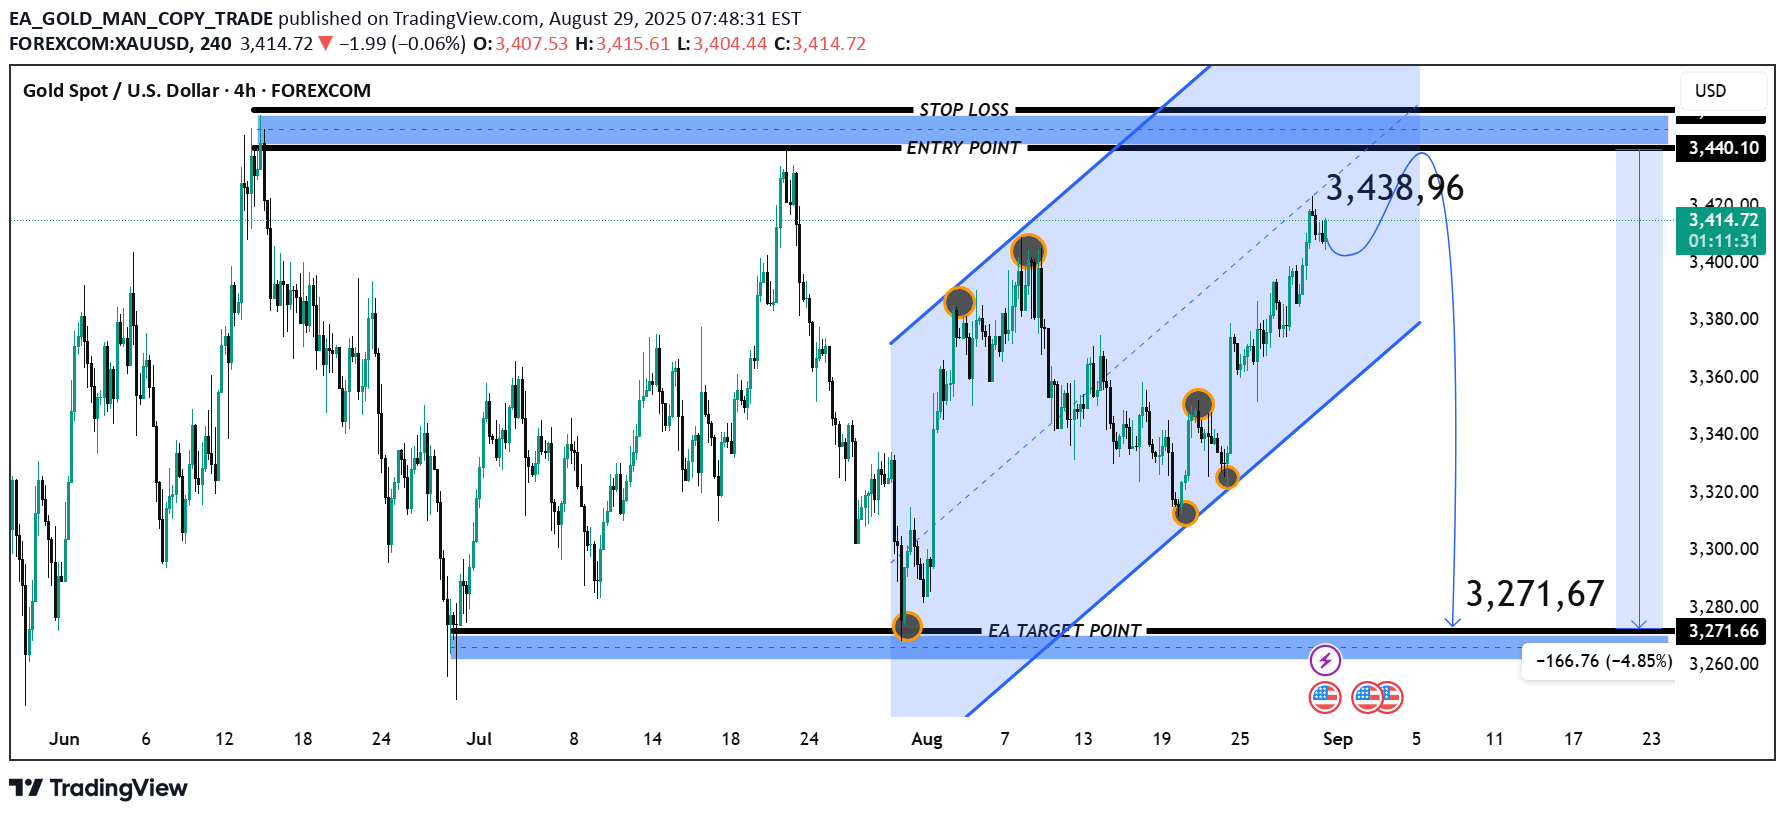
Current Price: 3,413.14 Resistance Zone: 3,438 – 3,441 (marked as Entry Point / Stop Loss Zone) Support Zone: 3,271 – 3,275 (EA Target Point) 📊 Chart Structure Ascending Channel (Blue Shaded Area): Price has been moving within an upward channel since early August, respecting both support and resistance lines. Resistance Test: Price is approaching the 3,438.96 resistance level inside the channel. This area coincides with the entry point zone marked on the chart. Projected Bearish Reversal: The drawn projection suggests a potential rejection at 3,438 – 3,441, leading to a decline toward the target support at 3,271.67. Risk Management: Entry: Around 3,438 – 3,441 (resistance test). Stop Loss: Just above 3,441 (to protect against breakout continuation). Take Profit: 3,271 (channel support + historical demand zone). Risk/Reward: Approximately 1:2.5 (good setup). 📝 Outlook Bearish Scenario (Preferred): If price fails to break 3,438 resistance, a reversal toward 3,271 is likely. This matches the channel’s lower boundary and strong support. Bullish Scenario (Alternative): If gold breaks and sustains above 3,441, further upside could open toward 3,480 – 3,500 levels. ✅ Conclusion: The chart suggests a sell setup near 3,438 – 3,441 with a target at 3,271, unless a breakout above 3,441 confirms continuation upward.
