Technical analysis by CRYPTIK1 about Symbol BTC on 8/25/2025

CRYPTIK1
▒₿▒ Distribution Top - Anatomy of a Bitcoin Cycle Top ▒₿▒
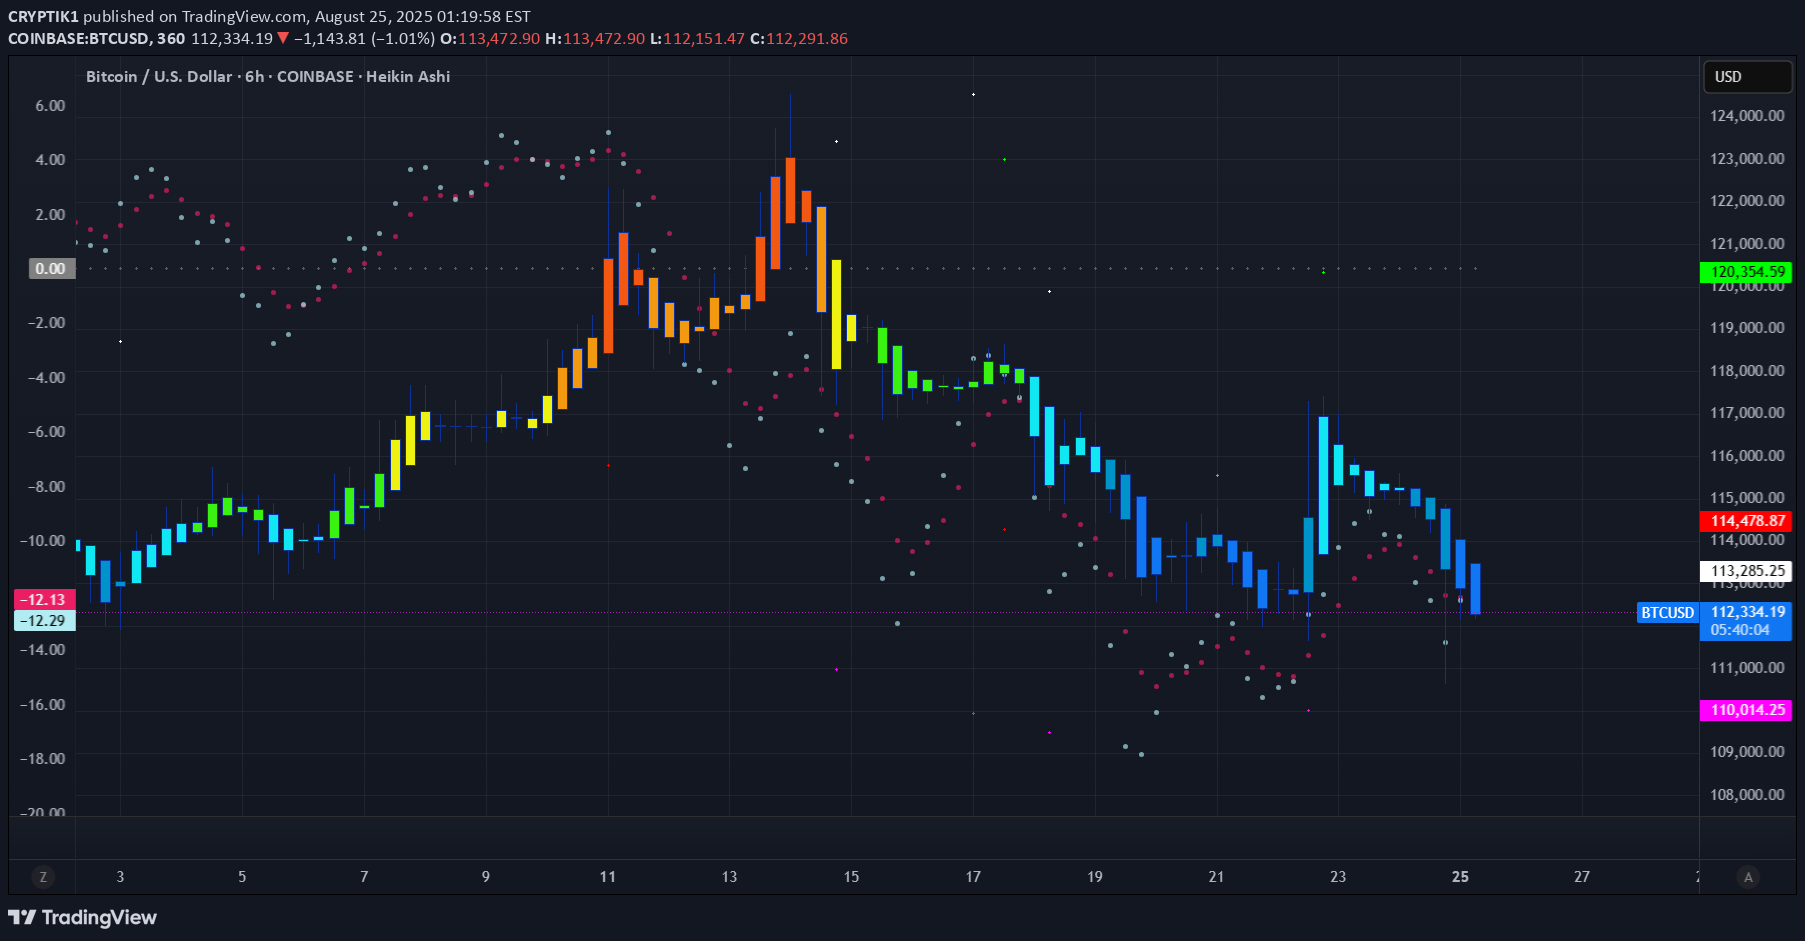
BTCUSD I've identified key price action indications that we have "topped" with an ATH for this Bull Market Cycle. There is a much deeper analysis that needs to be done here. While this price action is the first major clue, to confirm a true distribution top, we'll also need to analyze volume profiles for institutional selling, spot bearish divergences in key momentum oscillators, and watch on-chain metrics for any signs of whale or miner selling pressure. Every Bitcoin cycle has a story, and the final chapter is always the most dramatic. I've been analyzing the price action at every major cycle peak, and there's a recurring pattern that acts like a final warning before the curtain falls. It’s not the explosive top itself, but the messy, indecisive period that follows: the Distribution Top . This isn't just a pattern; it's the visual footprint of a massive transfer of wealth. It’s the moment when the cycle's early investors (smart money) begin to distribute their holdings to the late, euphoric buyers. Look at the price action from the November 2021 ATH top. After the euphoric peak, the clean, powerful uptrend dies. It's replaced by a volatile, sideways "wiggle." The Heikin Ashi candles lose their bodies, showing long wicks on both sides. This is the signature of market conflict and exhaustion. Cycle Tops vs. Local Highs: A Crucial Distinction It's important to understand that this "wiggle" is unique to major, euphoric ATH cycle tops. Other tops, like the one from August 2021 shown below, have a much different character. Notice how the rejection is sharper, faster, and lacks the prolonged, grinding "wiggle." This is often a rejection from a known resistance level, not the slow, painful end of cycle-wide euphoria. The "Distribution Top" is a process. It’s designed to churn, create confusion, and trap breakout traders before the real move down begins. It’s the market grinding at the highs, absorbing the last wave of FOMO. We saw this exact anatomy play out in the April 2021 top as well. The Key Takeaway for Bitcoin Investors: Recognizing this specific pattern is crucial for capital preservation. When you see this shift from clean momentum to choppy, indecisive grinding near an all-time high , it's a signal that the market character has changed. The risk is no longer to the upside; it's to the downside. While this price action is the first major clue, to confirm a true distribution top, we'll also need to analyze key trend lines, candlestick patterns, seasonality, volume profiles for institutional selling, and watch on-chain metrics for any signs of whale or miner selling pressure. Now, take a look at the most recent price action. We are seeing the early stages of this very same pattern developing after a new high. The question every Bitcoin holder should be asking is: Is this history rhyming once again? As I mentioned at the start of this post, there are much more metrics to analyze here, so I'll be updating this post with further findings. DISCLAIMER I AM NOT A FINACIAL ADVISOR, NOR AM I YOURS. THIS IS NOT FINANCIAL ADVICE. MEARLY DOODLINGS ON A MATHMATICALLY DRIVEN GRAPHICAL INTERFACE, TRACKING AN INVISIBLE 256BIT MILITARY-GRADE ENCRYPTED ASSET. . . FOR ENTERTAINMENT/AMUSEMENT PUROSES ONLY. ENJOY! Looking to hear your thoughts on this TradingView Profit_Through_Patience David_Perk ProjectSyndicate Xanrox_ HAMED_AZ melikatrader94This can be clearly seen in the 3HR and as these things do, is expected to play out in the 6HR, 12HR and ultimately to the Daily.The Wyckoff Method on the Weekly shows an 80% likelihood that the Bull Market Peak was $124K. It looks like we have Sign of Weakness with the next phase (Phase D), being a Markdown Phase.70% - 80%The weekly using the Wyckoff Method of analysis shows that we are reaching a point of "Buying Climax" which is a significant warning sign that represents a point of trend exhaustion where buying from the general public reaches a peak, often signaling the point where smart money begins to sell or distribute their holdings.