Technical analysis by Old-School-Crypto about Symbol ETH on 8/24/2025

Old-School-Crypto
ETH Trend Analizi
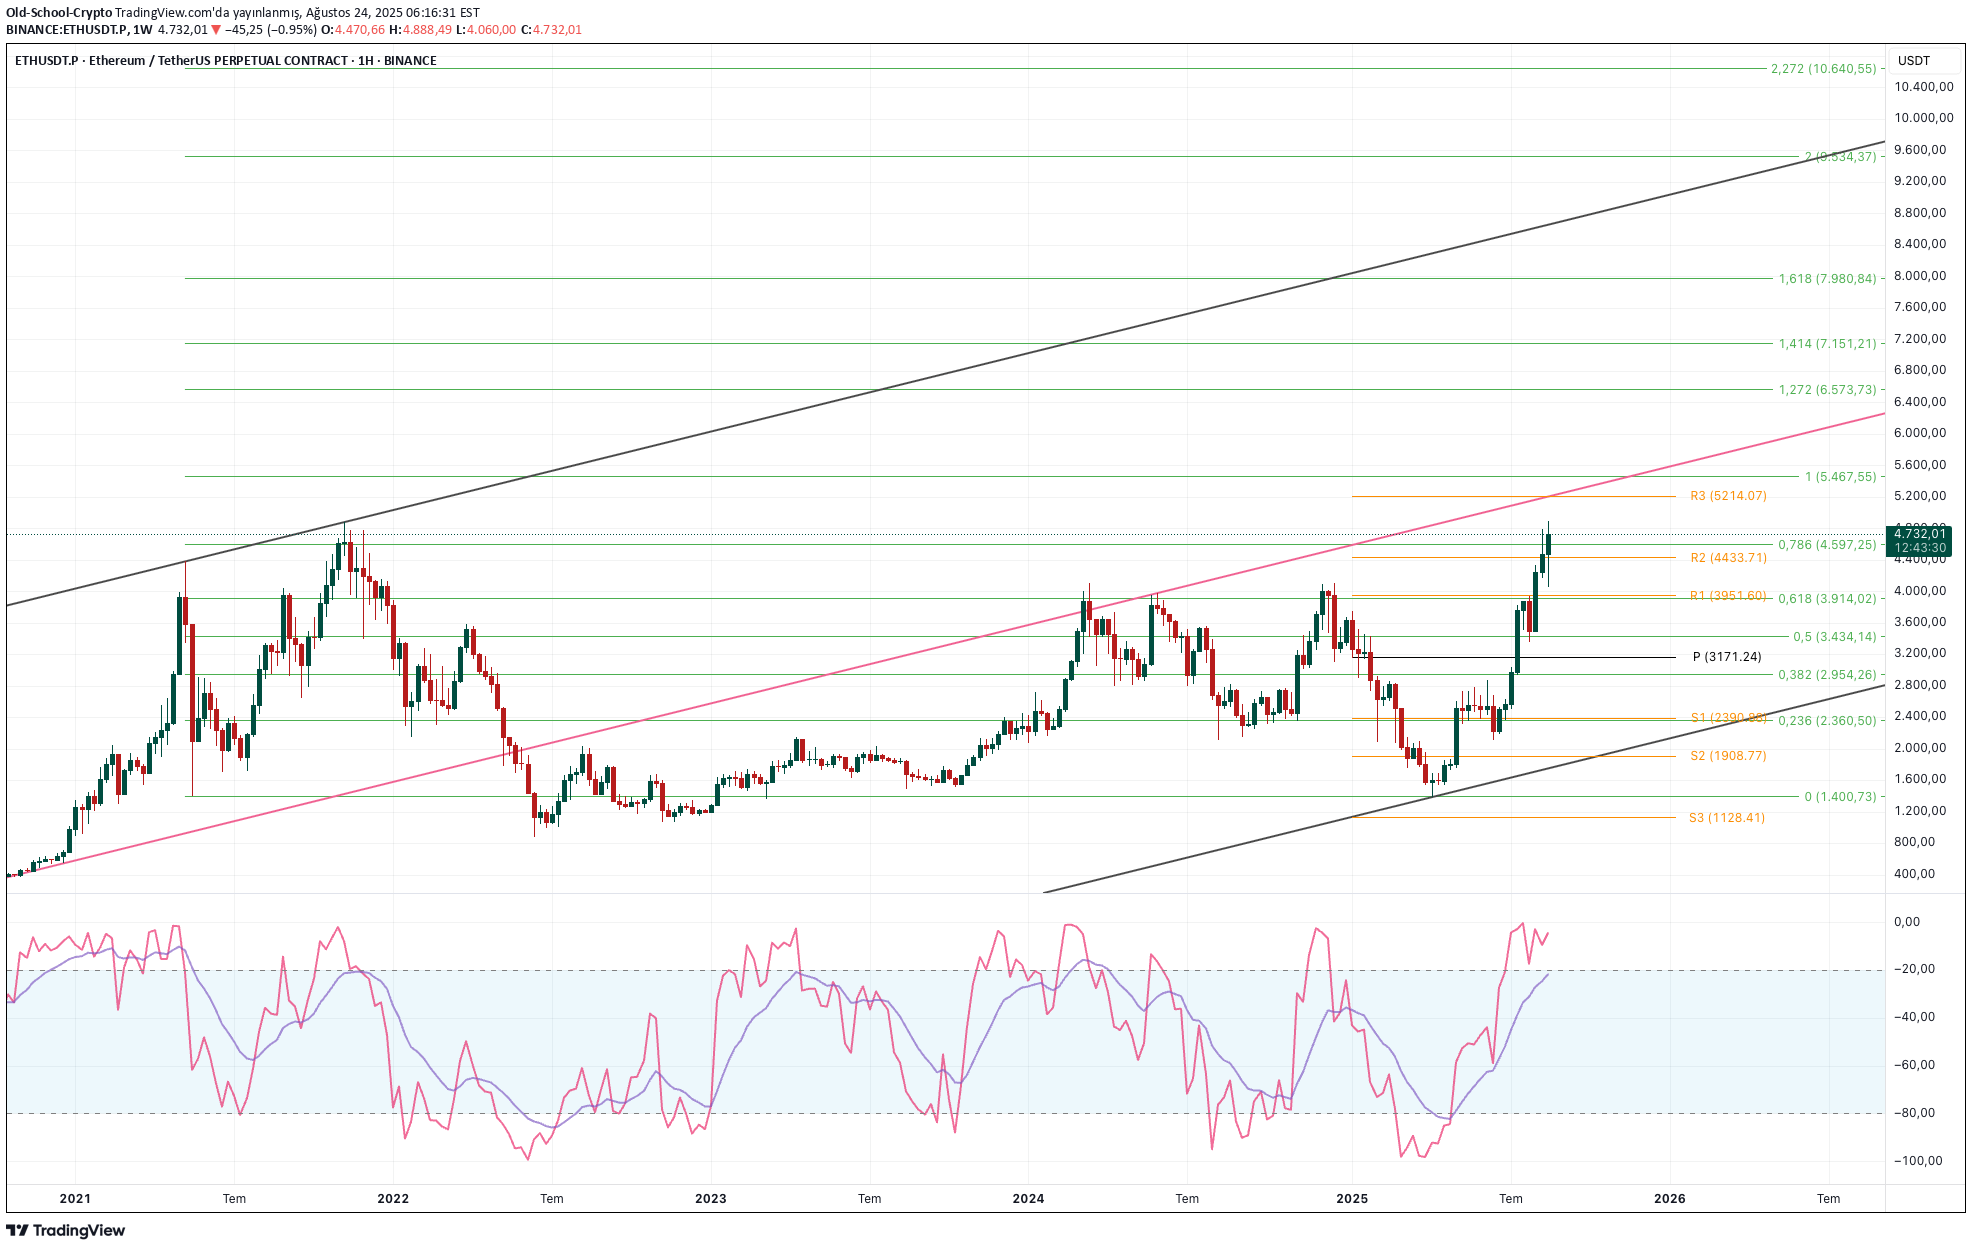
Ethusdt.p When we look at the weekly graph, you can read the long -term trend x -ray on the graph. May 2021 and November 2021 high hills after the broken trend entered the month of the month of the month, with the last decline of the 1400s as a trend bottom by determining a strong upward trend. And by breaking the $ 4877.54 AC in November 2021, this week we were in the new historical summit as $ 4888,49. In the graph, the channel we saw with the red line had experienced a withdrawal twice before the median. Now we see that he is trying to put it on the channel media again. We see that the Median border is in the $ 5214s with weekly Pivot R3 levels. Just above the main rise trend Fibo 1 level $ 5467s ... Ethereum Will the media be able to leave on these values, which are necessary for it to jump on it? Or will he have to withdraw back to gather power by eating rejection from these levels once again? If we assume that it will close the present, this weekly closing at the levels where it is now, Williams %r will tell us some things. If you pay attention, there is a negative incompatibility between price hills and %R (pink wave). While the price hills rise, the descent of %R hills is considered as a strong negative incompatibility and therefore a sign of decrease. Williams has also reached %R saturation limits Ethusdt.p Although its strong appearance and the recently increasing interest of whales, it seems to progress in a route that will gather power with a correction in order to reach $ 10000, which is the expectation of many, to reach the channel ceiling and jump to the upper channel. You can find my opinion on a harmonic formation projection that he is currently in, where this withdrawal may be. I recommend you to review it.