Technical analysis by Pepperstone about Symbol SPYX on 8/21/2025
Pepperstone
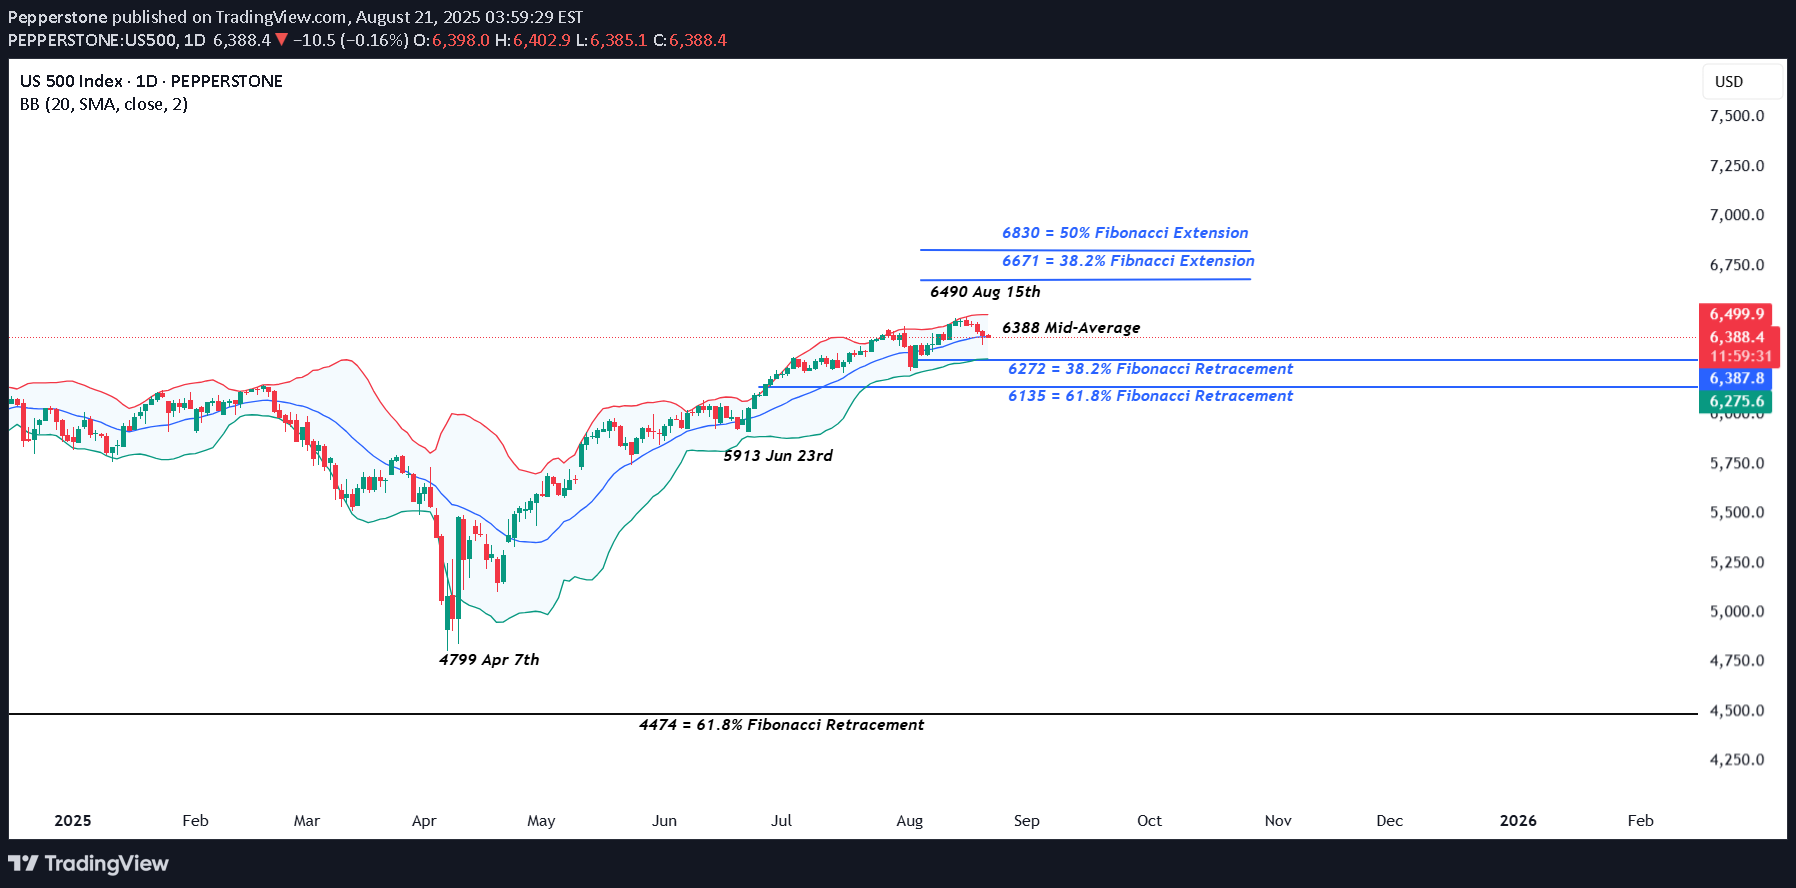
It's been a nervy couple of days for the US 500 index with US technology giants led by NVIDIA taking a hit as traders looked to reduce some risk ahead of Federal Reserve (Fed) Chairman Jerome Powell's Jackson Hole Symposium speech on Friday (1500 BST), where he could shed some light on whether or not the current market expectation of 2 25bps (0.25%) interest rate cuts in 2025 is correct or overblown. This down move in these key Magnificent Seven stocks has had an outsized influence on the direction of the US 500 due to their large index weightings, and saw prices trade from a record high of 6490 on August 15th down to a low of 6347 yesterday (August 20th). Before we get to the Jackson Hole risk event, later today US 500 traders will have to negotiate the earnings update from retail giant Walmart, which is released before the market close and will provide a crucial insight into the current spending patterns of US consumers, and perhaps more importantly, update traders on what spending may look like across the remainder of 2025. Then, the US preliminary PMI surveys for August are due at 1445 BST. These are important forward-looking reports on manufacturing and service activity in the US economy and will provide a health check on the direction of growth, including updates on new orders, employment and costs. Any reading below 50 = economic contraction and any reading above 50 = economic expansion. The service activity reading, which hit a 7-month high at 55.7 in July is possibly the more relevant release for traders given that it’s been the main driver of US growth for many months now while manufacturing has struggled. Any deviation from expectations could lead to further US 500 volatility. Technical Update: Test or Break of Bollinger Mid-Average Support? On Friday, August 15th, the US 500 index successfully posted a new all-time high at 6490. However, price action has since turned lower, resulting in a sell-off this week. As shown on the chart below, the index is currently testing a potential support level, marked by the Bollinger mid-average, which at the time of writing, stands at 6388. Traders often use the mid-average as an indicator of directional risk. While prices remain above this level, the market is generally considered to be in a positive trend, but when price activity falls below the mid-average, it may signal the development of a downtrend. Therefore, how the 6388 mid-average level is defended on a closing basis over the coming 2 days might indicate the next possible phase of price movement. A close above this level may reinforce support and suggest a potential rebound in price, while a close below it could open the door to further price downside. With this in mind, let’s take a look at the possible support or resistance levels to consider ahead of the key risk events across the remainder of the week. Possible Resistance Levels: As long as the 6388 mid-average support continues to hold on a closing basis, the uptrend could be classed as still intact. This is supported by the pattern of higher highs and higher lows forming in price since the April 7th low. As the chart above shows, this setup could be suggesting potential for further price strength, with the initial resistance at the 6490 August 15th all-time high. A closing break above here could then open scope toward 6671, which is equal to the 38.2% Fibonacci extension level. Potential Support Levels: While not a guarantee of a more extended price decline, closes below the Bollinger mid-average at 6388, if seen over coming sessions, may reflect increasing risks for a deeper sell-off. Such moves might suggest potential for moves down to the next support at 6272, which is the 38.2% retracement level. If this level is in turn breached, focus may then shift to 6214, which is the August 1st low, as the next key support. The material provided here has not been prepared accordance with legal requirements designed to promote the independence of investment research and as such is considered to be a marketing communication. Whilst it is not subject to any prohibition on dealing ahead of the dissemination of investment research, we will not seek to take any advantage before providing it to our clients. Pepperstone doesn’t represent that the material provided here is accurate, current or complete, and therefore shouldn’t be relied upon as such. The information, whether from a third party or not, isn’t to be considered as a recommendation; or an offer to buy or sell; or the solicitation of an offer to buy or sell any security, financial product or instrument; or to participate in any particular trading strategy. It does not take into account readers’ financial situation or investment objectives. We advise any readers of this content to seek their own advice. Without the approval of Pepperstone, reproduction or redistribution of this information isn’t permitted.
