Technical analysis by Ikeyhan about Symbol PENGU: Sell recommendation (8/21/2025)

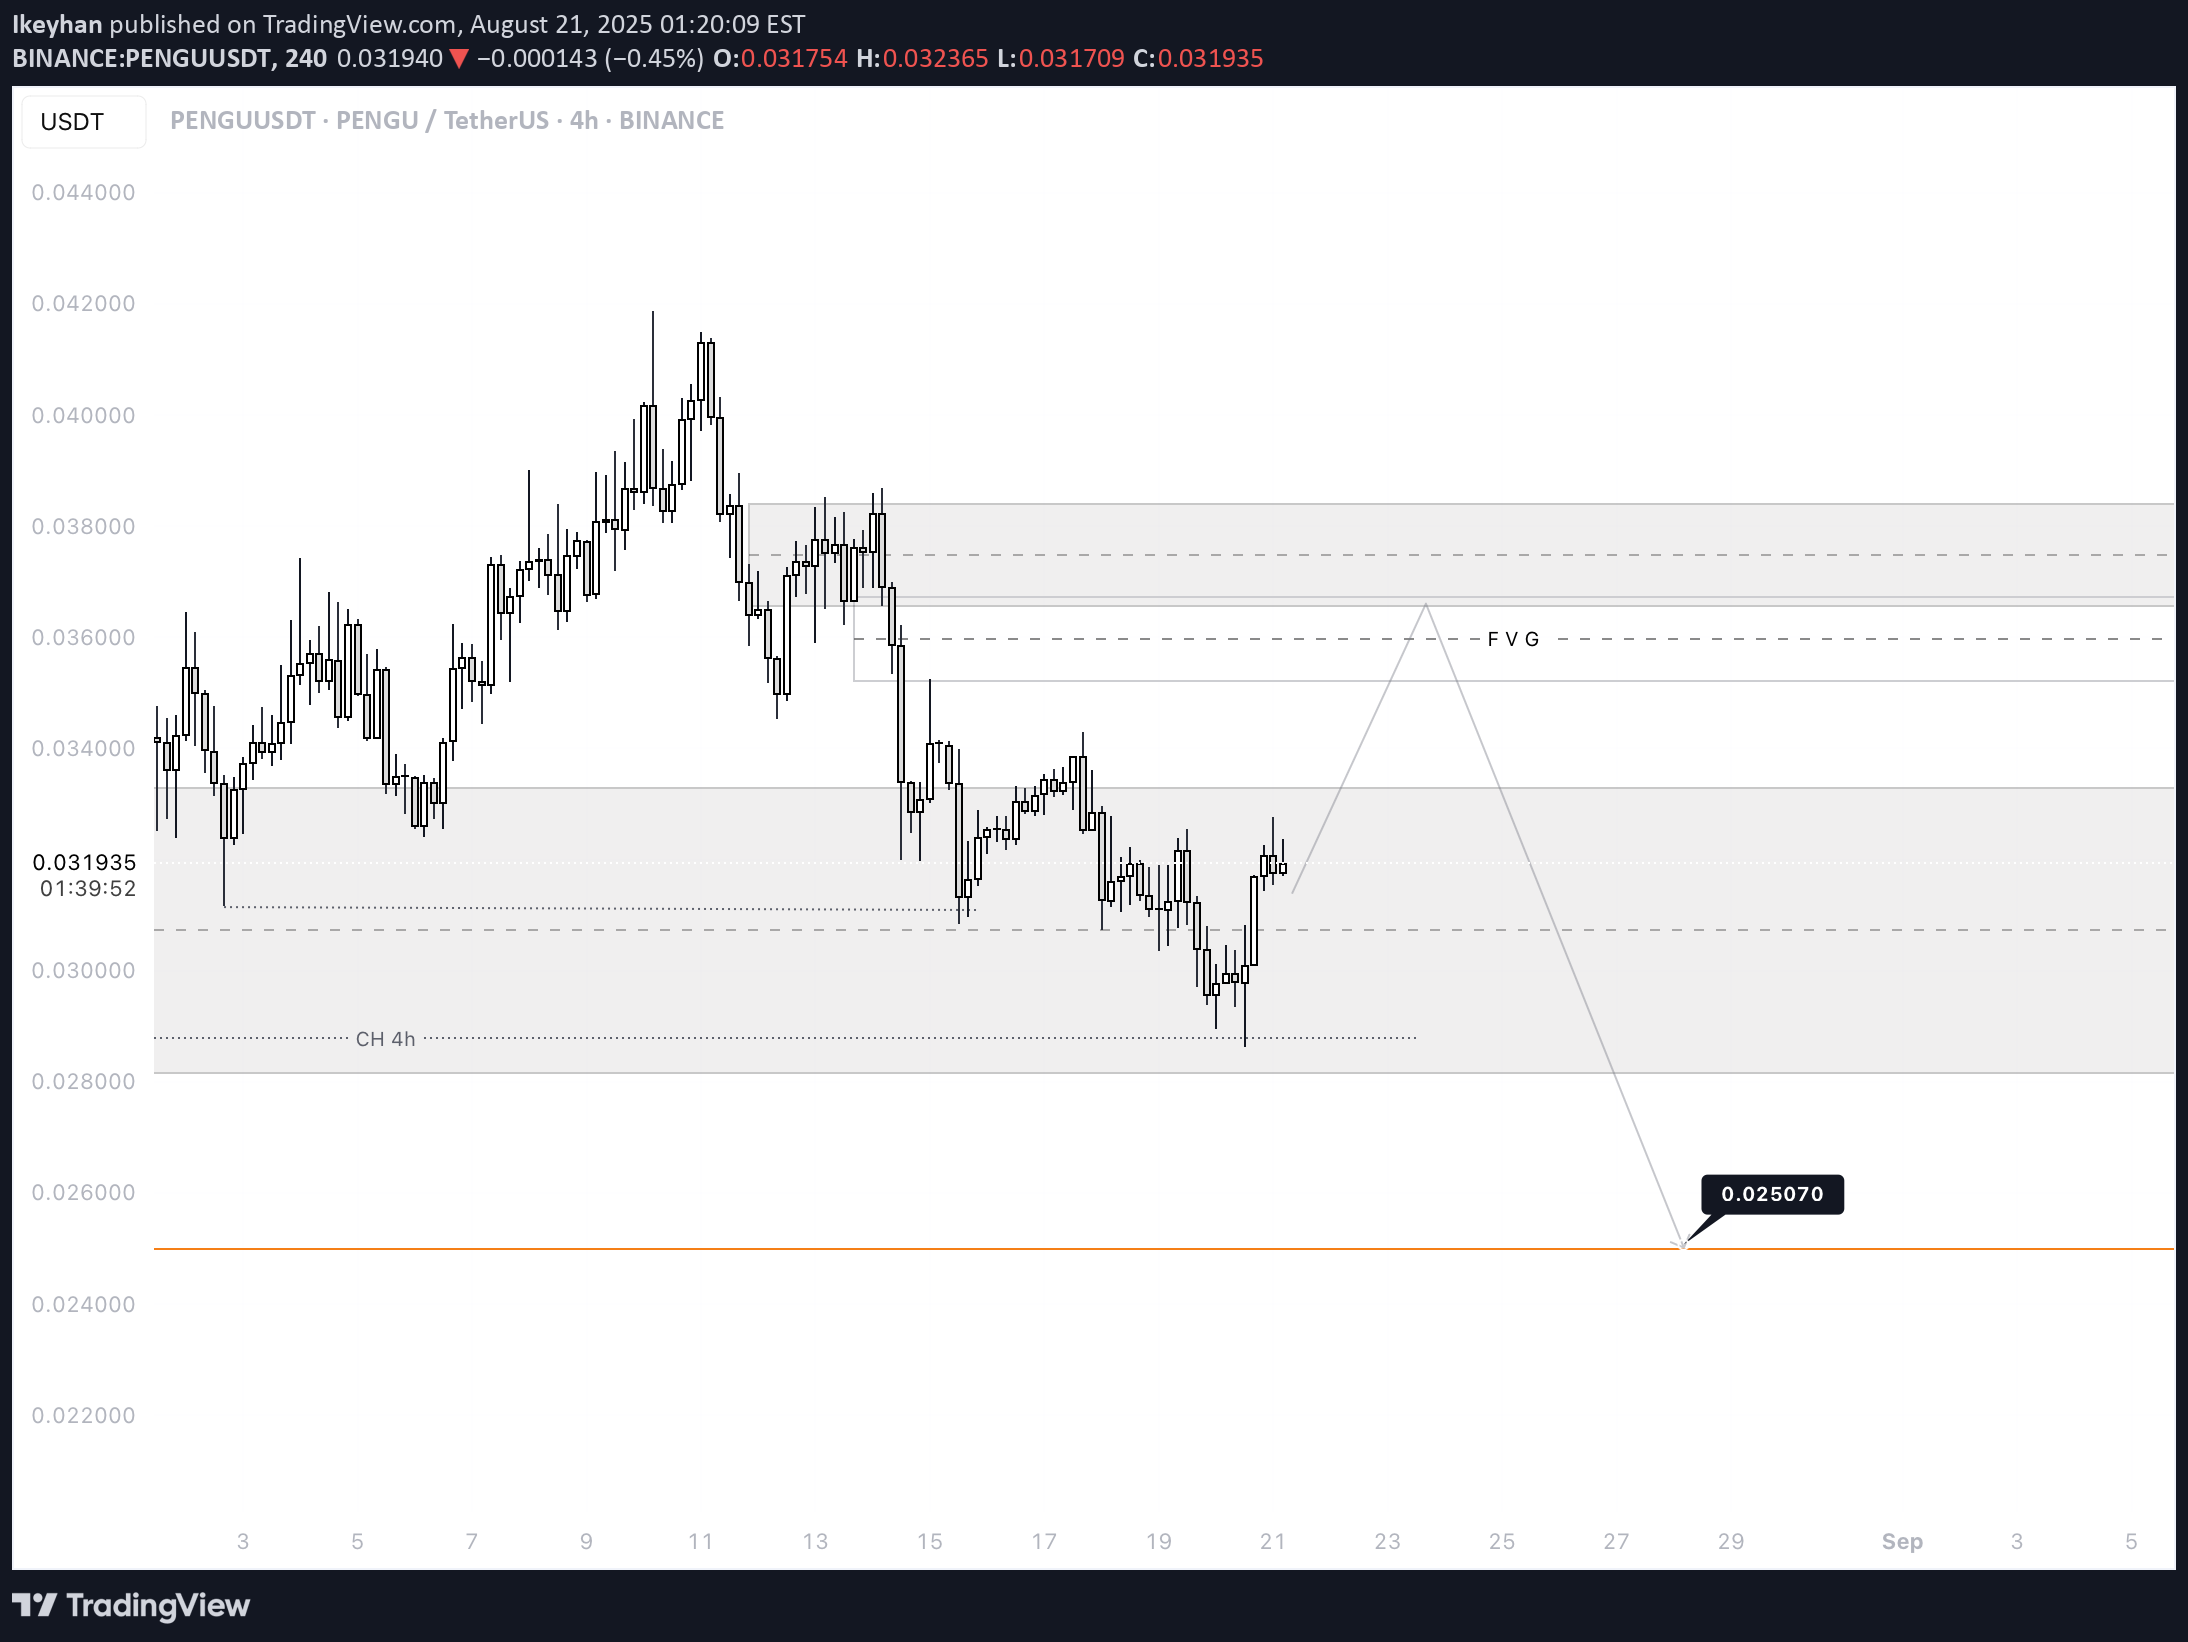
✅ PENGU/USDT — 4H (Binance) | Aug 21, 2025 — Professional Technical Analysis 🔎 Chart Context •Pair: PENGU/USDT •Exchange: Binance •Timeframe: 4H •Current price: 0.03309 •Market is in a bearish corrective phase, with lower highs since the peak at 0.041867. •Currently rebounding from a support zone, but the dominant structure remains downward until higher levels are reclaimed. 📊 Key Observations 1.Market Structure •High: 0.041867 (local top). •Subsequent lower highs: 0.038684 → 0.034526 → 0.034304. •Recent low: 0.030841. •This confirms a clear downtrend, with rallies acting as retracements. 2.Support & Demand Zones •0.03117 – 0.03084: Key short-term demand block where buyers stepped in. •0.02850 – 0.02780 (CH 4H): Mid-term liquidity support. •0.02507: Long-term downside target (liquidity magnet). 3.Resistance & Supply Zones •0.03430 – 0.03452: Immediate resistance area. •0.03750 – 0.03868 (FVG zone): Strong supply + fair value gap, likely to act as rejection zone. 4.Fair Value Gap (FVG) •Located around 0.03750 – 0.03868. •Price may retrace into this imbalance before resuming downward move. 📈 Bullish Scenario (Corrective Rally) •Price holds above 0.03117 – 0.03084 and pushes higher. •Likely targets: •TP1: 0.03430 •TP2: 0.03750 – 0.03868 (FVG fill). •Sustained breakout only possible above 0.03868, but probability remains low in current structure. 📉 Bearish Scenario (Higher Probability) •Price rallies into 0.03430 – 0.03868 (FVG) and faces rejection. •Expected continuation lower toward: •TP1: 0.03117 – 0.03084 •TP2: 0.02850 (CH 4H zone) •Final Target: 0.02507 (major liquidity sweep). ⚡ Trading Plan •Short Setup (Preferred): •Entry: 0.03430 – 0.03868 (supply / FVG). •TP1: 0.03117 •TP2: 0.02850 •TP3: 0.02507 •Stop: Above 0.03900 •Long Setup (Countertrend): •Entry: 0.03117 – 0.03084 (support defense). •TP: 0.03430 – 0.03750 •Stop: Below 0.03050 ✅ Conclusion PENGU/USDT is in a downtrend, but showing signs of a corrective bounce. The most probable path is a rally into 0.03750 – 0.03868 (FVG), followed by a bearish continuation targeting 0.02507 in the coming sessions. Only a break and close above 0.03868 would shift the momentum to bullish.
