Technical analysis by Bosukaaa about Symbol TRX: Sell recommendation (15 hour ago)

Bosukaaa
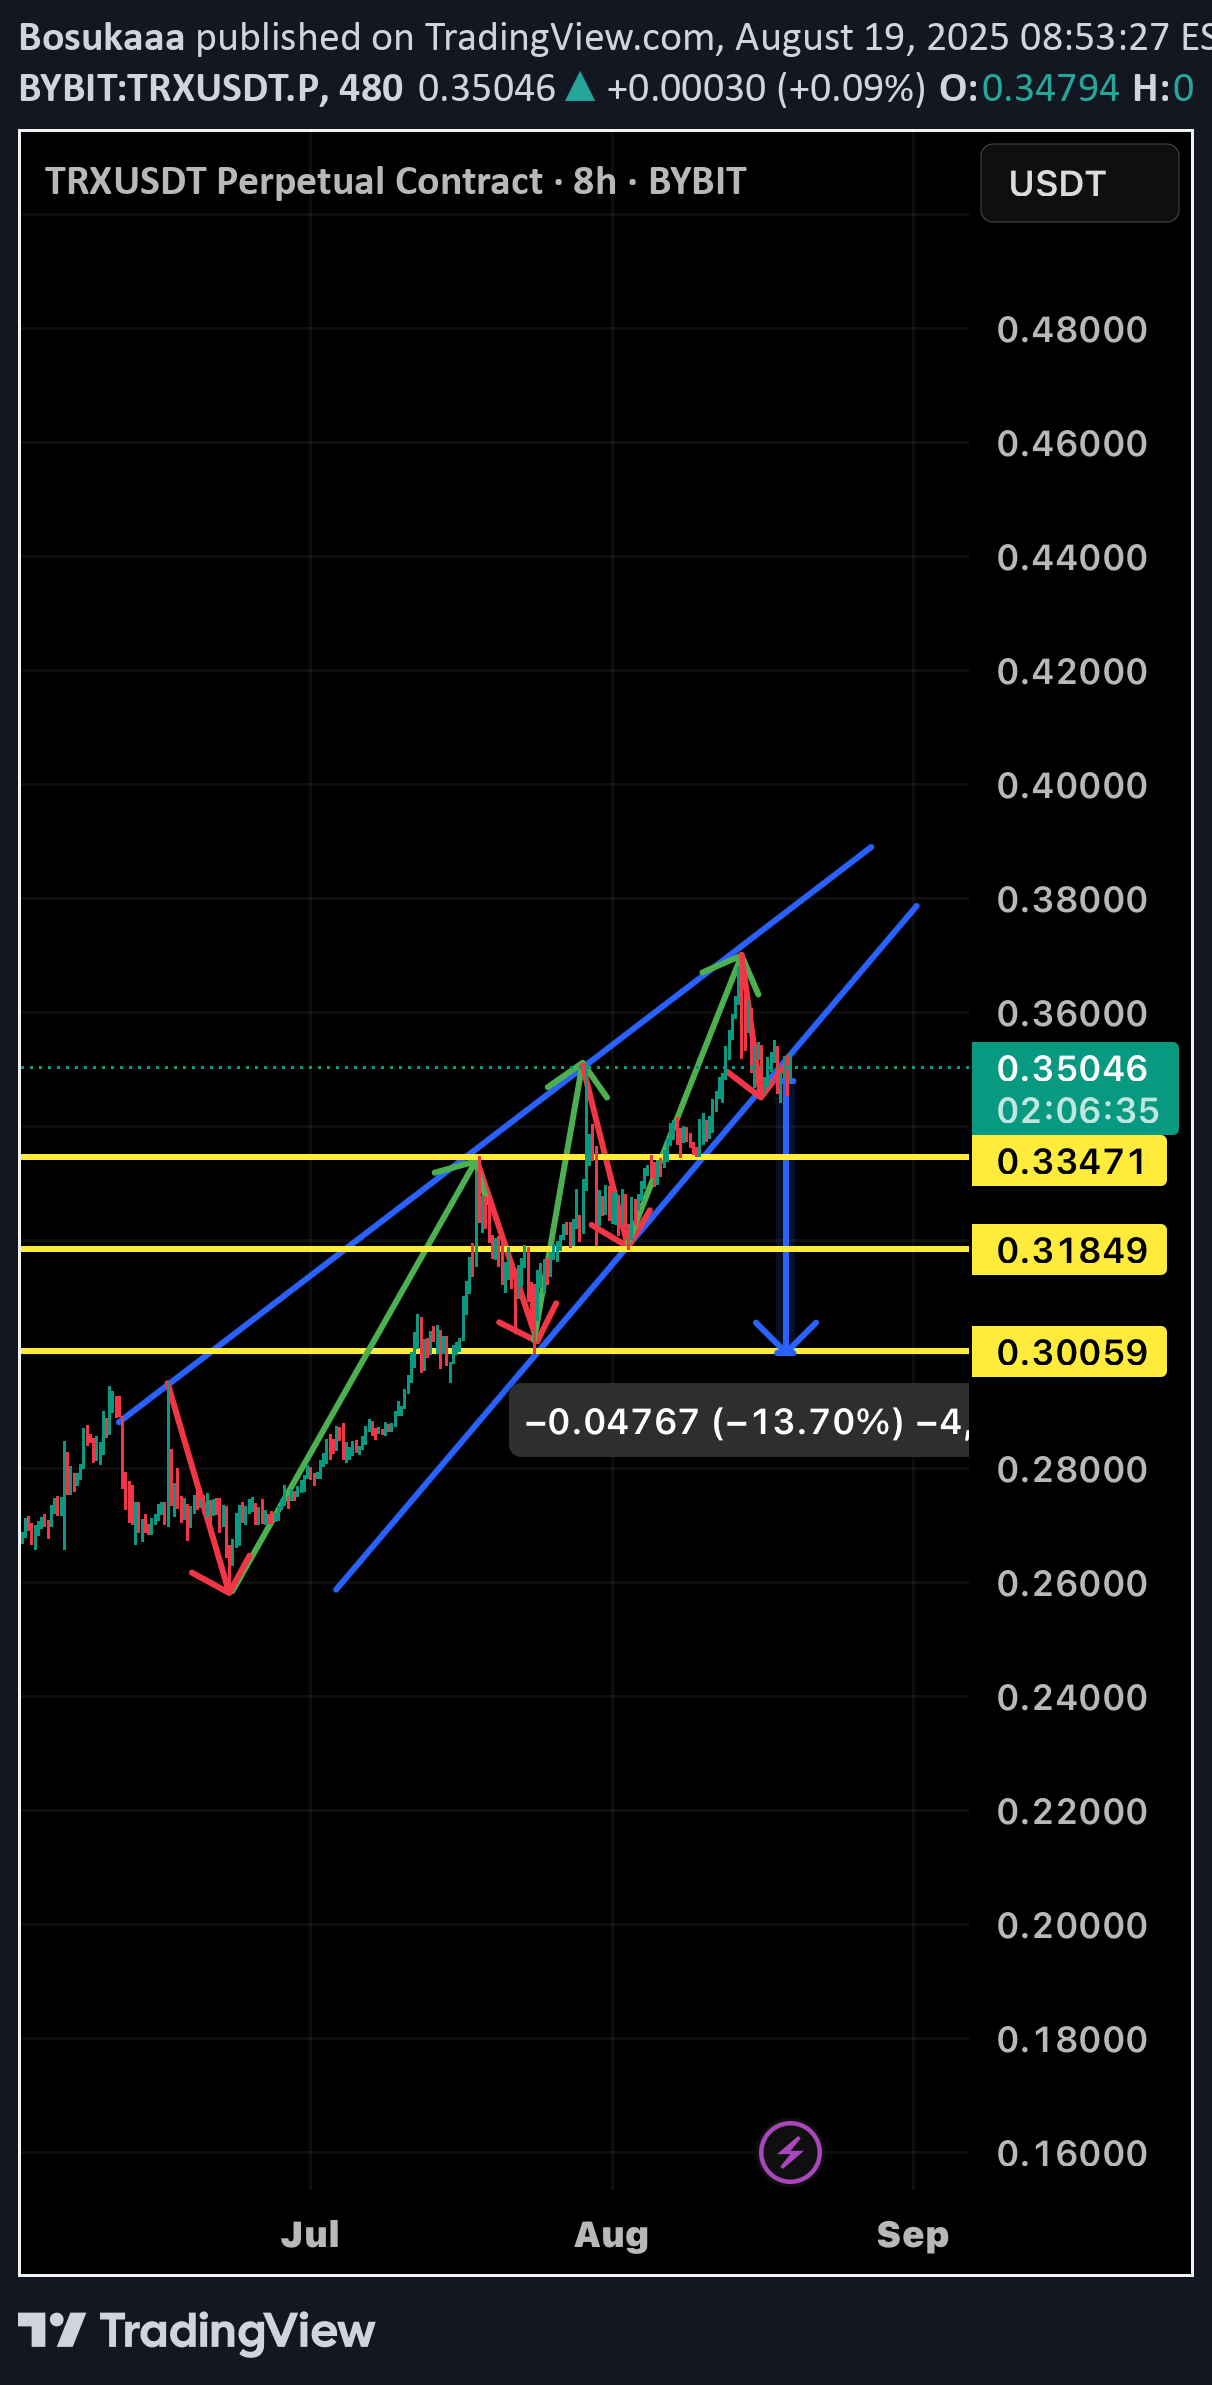
📊 TRXUSDT (8H) – Technical Analysis TRX has been moving within an ascending channel (blue lines) over the past weeks, repeatedly testing both the upper and lower boundaries. After the recent peak, a stronger correction started and is still in progress. 🔻 Based on the chart, there is a potential -13.7% pullback, pointing to the following key support levels: •0.3347 USDT – first support (previous local low, yellow line). •0.3185 USDT – stronger support zone that has been tested multiple times. •0.3006 USDT – major support level, aligned with the projected target area. 📌 Scenarios: •As long as TRX stays within the ascending channel, the trend remains bullish. •Losing the 0.3347 and 0.3185 supports could open the way down to 0.3006. •On the upside, resistance is seen near 0.36.
