Technical analysis by SupertradeOfficial about Symbol AAPLX: Sell recommendation (8/19/2025)

SupertradeOfficial
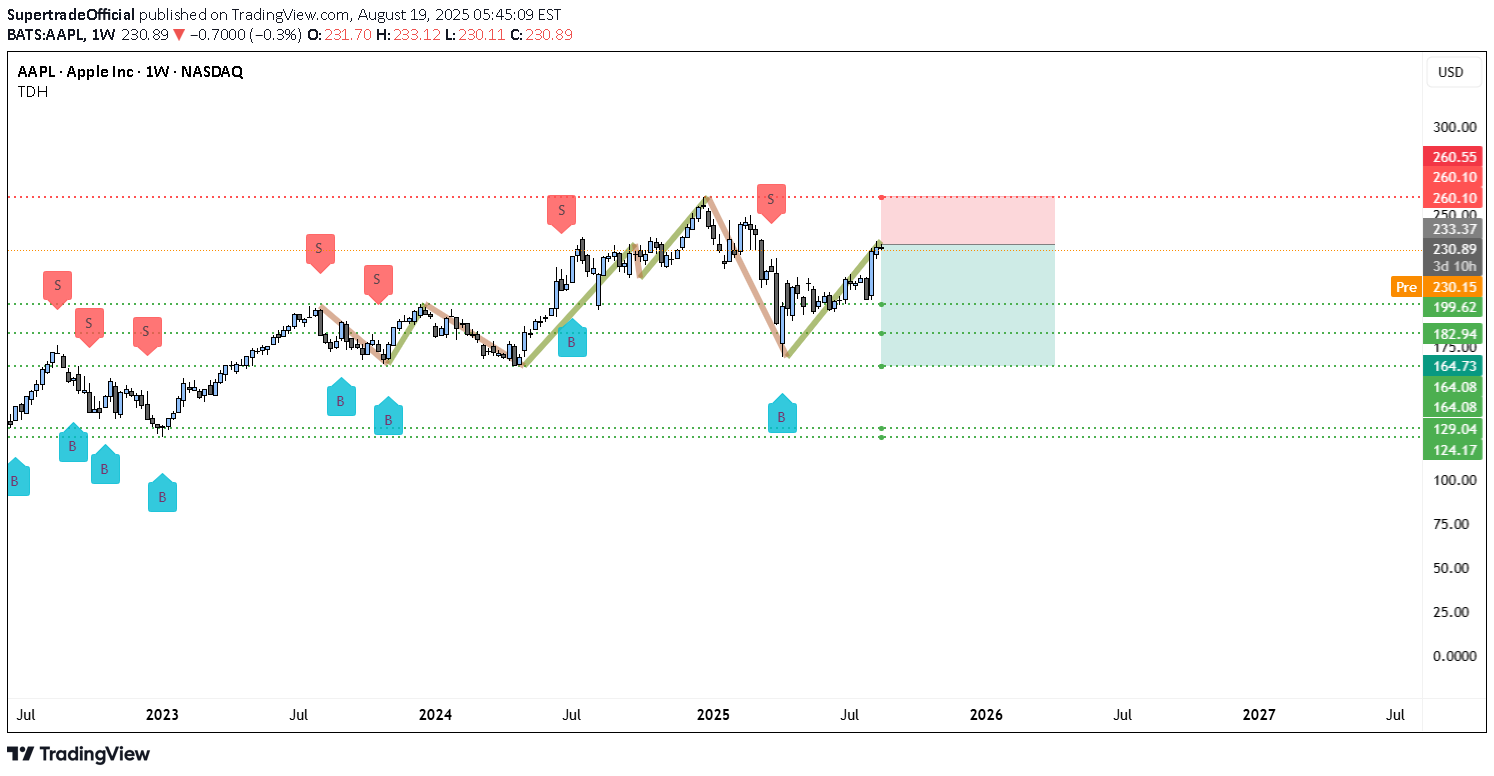
🍎 AAPL Weekly Chart Analysis — Bearish Outlook Apple (AAPL) is trading near $230–233 on the weekly chart after staging a rebound from early 2025 lows. The chart, however, shows a clear double-top pattern around the $260.10–260.55 resistance zone (red dashed line), which has repeatedly acted as a ceiling. Each test of this zone has been followed by sharp corrections, and the most recent “S” (sell) marker confirms this rejection area as a strong supply zone. The latest rally has brought price back toward resistance, but structure-wise AAPL is printing lower highs and lower lows since mid-2024. The bounce into $230–233 looks more like a relief rally within a larger corrective phase rather than a fresh bullish trend. ________________________________________ 🔎 Bearish Justifications •Double/Triple Resistance Layer: $260 has capped price multiple times. Without a clear weekly close above it, bears remain in control. •Trend Structure: From July 2024 peak to early 2025 lows, price made a decisive lower low. The current rally has failed to reclaim that structure. •Volume Trap: Weekly candles show waning momentum on rallies—less aggressive buying versus prior uptrends. •Clean Downside Ladder: The chart highlights green dotted support zones at $199 → $182 → $164 → $129 → $124. If $230–233 fails to hold, price could unwind quickly toward these levels. ________________________________________ 🔴 AAPL Short Setup (Weekly Chart) •Entry Zone: $230–233 rejection area (current price) •Stop-Loss: Above $260.55 (strong invalidation level, beyond supply zone) ❌ •Target 1: $199 (psychological + technical support, book partial profits ✅) •Target 2: $182.94 (major mid-term support, lock more gains 🔒) •Target 3: $164.73 (deeper corrective target if selling accelerates 📉) •Stretch Target: $129–124 if broader market weakness hits tech ________________________________________ ⚠️ Risk & Trade Management Given that this is a weekly timeframe setup, swings will be larg6e and volatile. Position sizing should be smaller than usual because stops and targets are wide. Booking partial profits at $199 and $182 is essential — this way, you reduce risk exposure and can let the remainder run. If AAPL surprisingly pushes above $260 and closes strong, the bearish thesis is invalid and shorts should exit rather than hold against trend. ✅ In summary, AAPL looks heavy under $260, with the current bounce likely a retracement rally rather than fresh bullish strength. Unless bulls can flip $260 into support, the chart favors a short bias with targets at $199 → $182 → $164.
