Technical analysis by DL_INVEST about Symbol GOOGLX on 4/6/2024

DL_INVEST
Alphabet Inc (Google) Class A
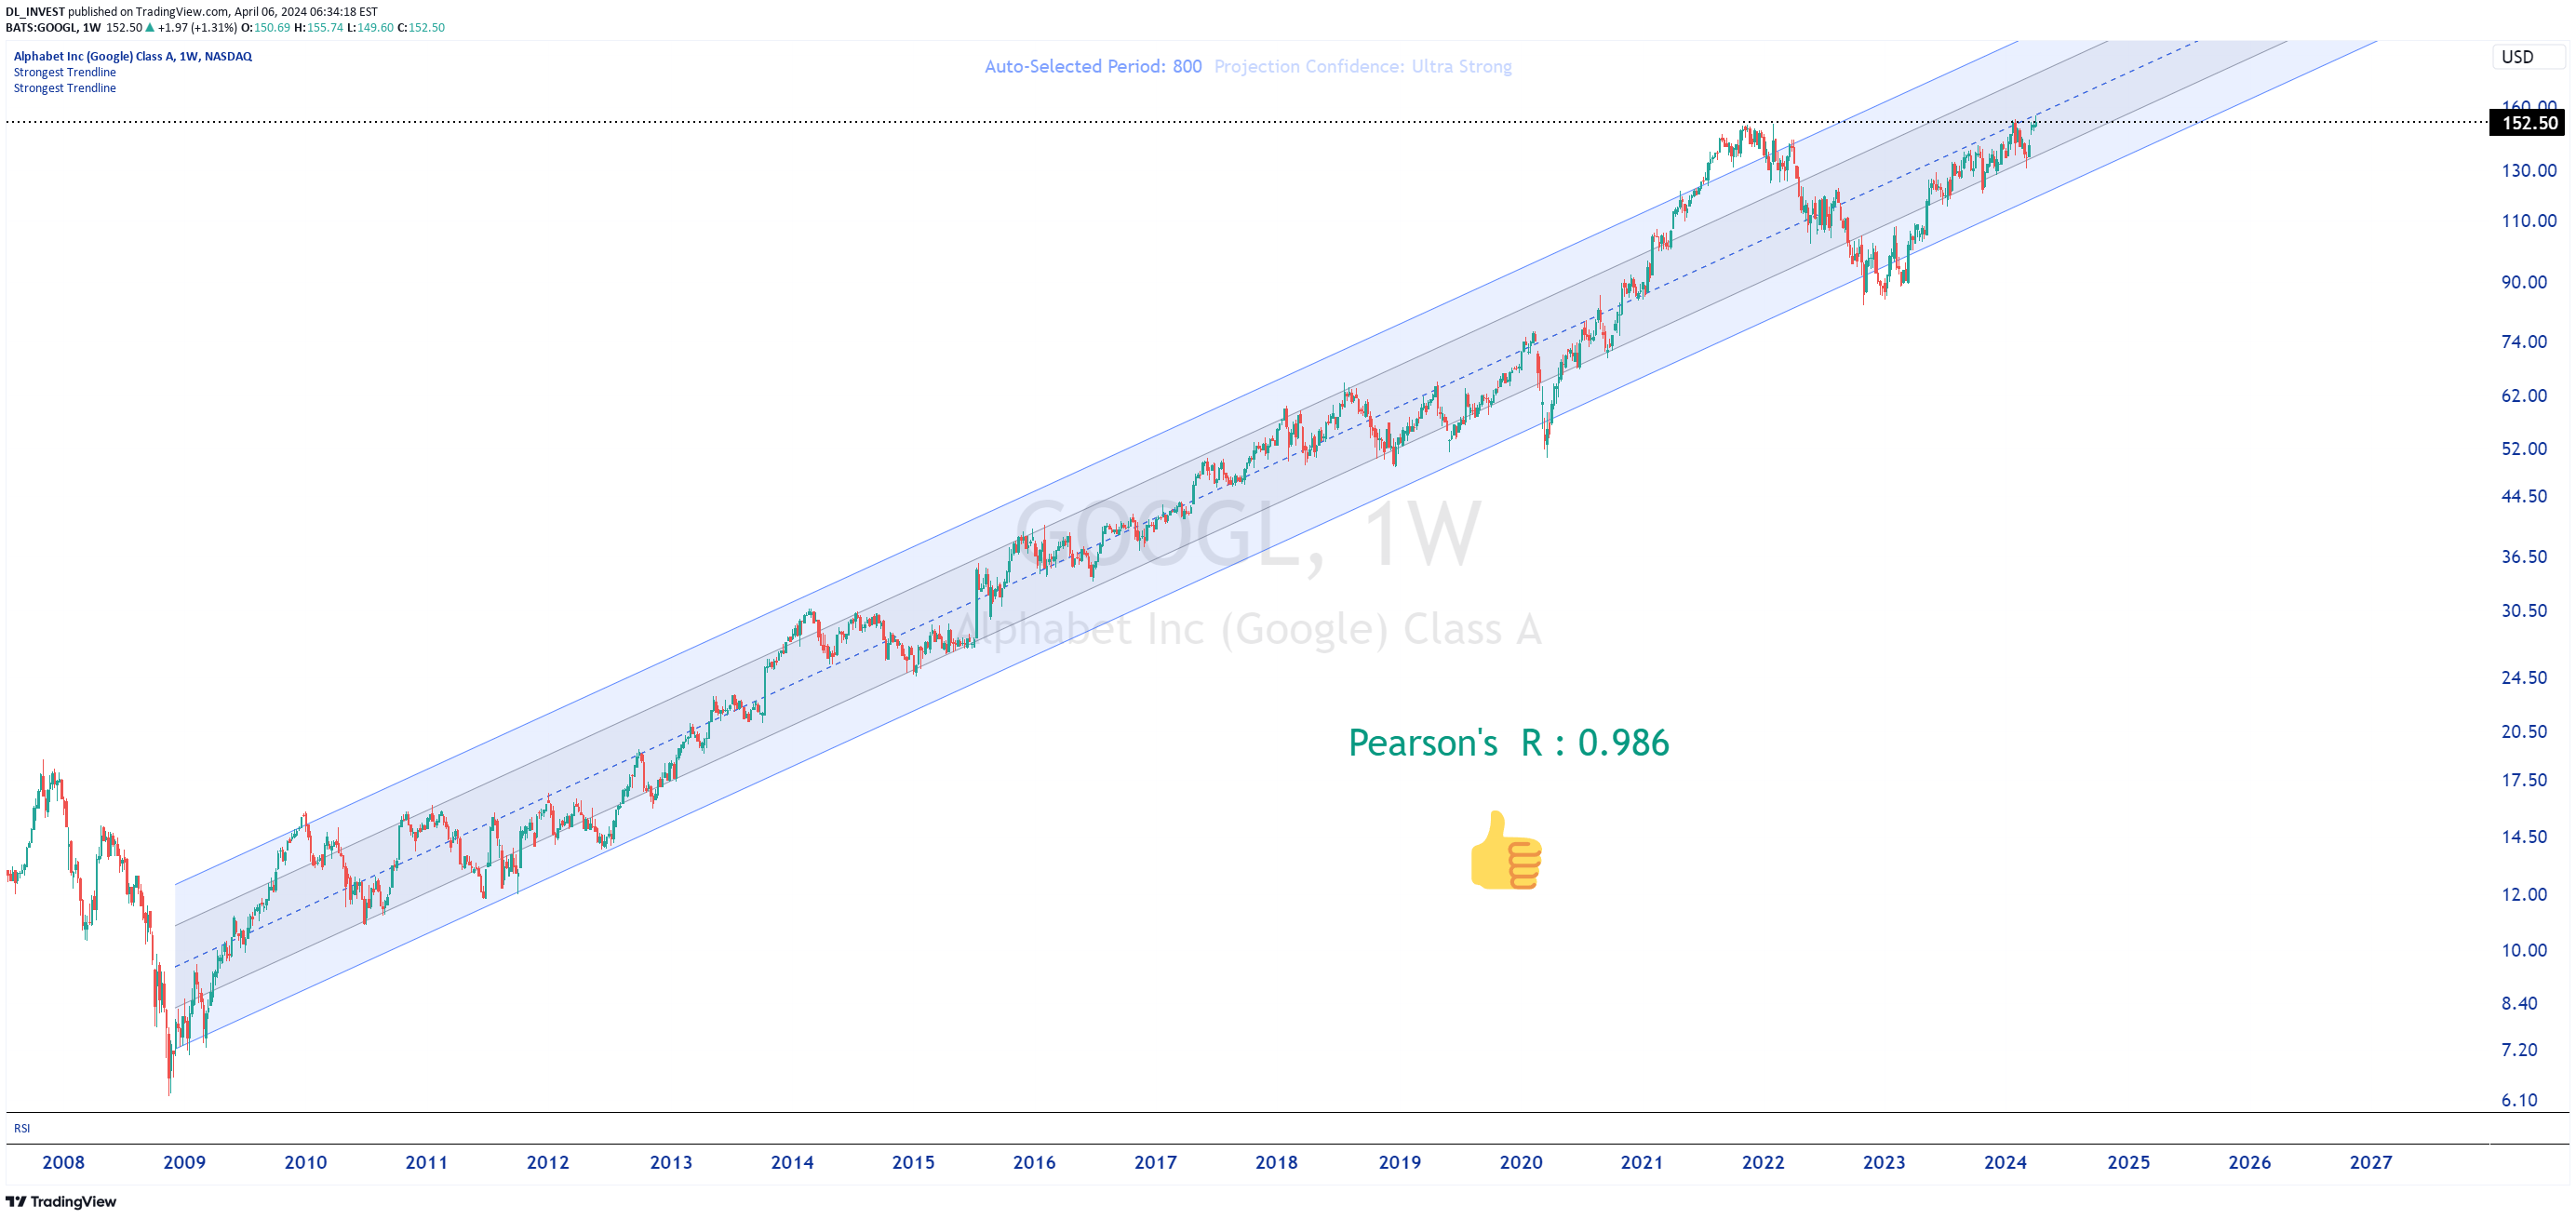
Weekly chart in logarithmic scale. Friend indicator Julien_Eche 1. Overall Trend: - The chart shows a long-term bullish trend for Google's (GOOGL) stock. The share price has seen steady progression from 2009 to 2024. 2. Trading Channel: - A well-defined trading channel can be identified, with parallel trendlines that establish the range of fluctuations in the long run. - The price moves within this channel, with regular bounces off the support and resistance lines. 3. Consolidation Phases: - Some consolidation phases are observed, where the price has seen lateral movements, such as in 2011-2012 and 2018-2019, before resuming the uptrend. 4. Upside Potential: - Currently, the price seems to be near the upper limit of the channel, suggesting limited upside potential in the short term. - However, the trading channel implies the possibility of continued long-term bullish trend, if the price can decisively break above this current resistance level. In summary, the chart displays a long-term bullish trend for Google's stock, with a well-established trading channel that frames the price fluctuations. This suggests further upside potential, provided the price can overcome the current resistance. Make up your mind before placing an order. ► Please boost, comment, subscribe!