Technical analysis by RSI-Guy about Symbol MSTRX on 4/9/2024

RSI-Guy
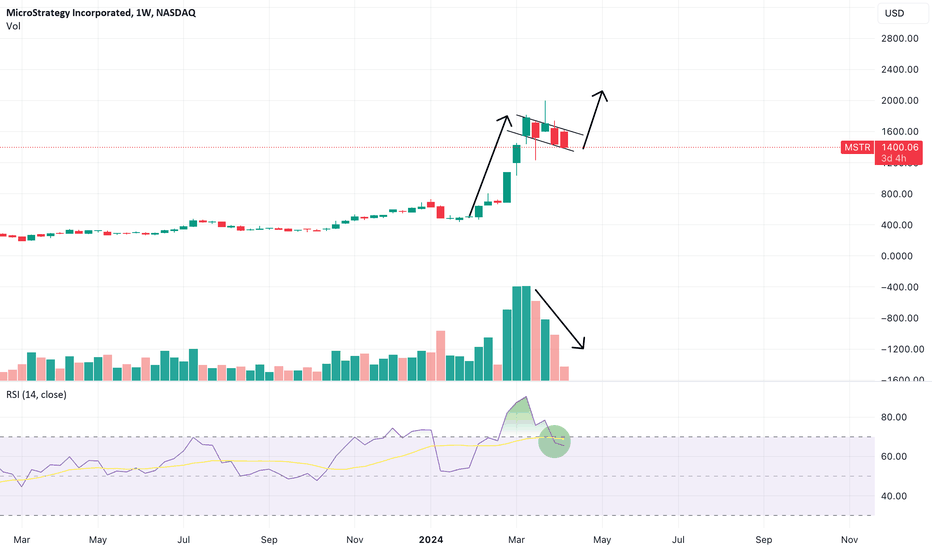
When you zoom out, it's hard to ignore the bull flag pattern that's forming on the weekly. $1400 seems to be acting as the current support. I feel like a convincing close beneath this level will invalidate the flag, but if we get a bounce here, we might be on a new leg up. Price target? Not sure. $2K makes sense as the most obvious psychological resistance level, and the previous failed test area. If we get a strong rebound and maybe a decent volume of liquidated shorts, maybe we push on stronger toward $2200 in the short-term. Definitely one to watch!Forgot to add - Volume's dropping off which could hint at a consolidation, and the price action has now returned from the overbought region (not that I think this latter detail is especially important, but it's an additional point to consider).
