Technical analysis by Nabi_Gunduz about Symbol BTC on 8/18/2025

Nabi_Gunduz
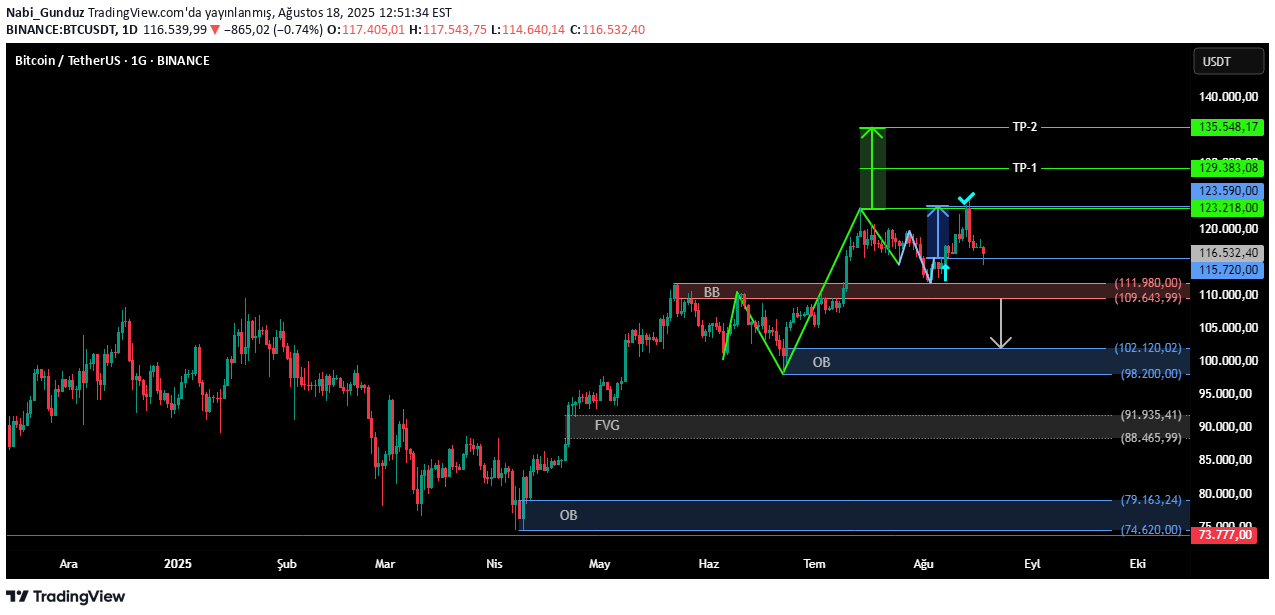
In order for the price that successfully reaches its target with the upward break of the 115720 signal level to produce a new rise signal, we need to see the weekly candle closure on the signal level of the formation that is seen with green in the graph and the weekly time period at 123218. I don't know if this signal occurs, if it occurs, how long it occurs or gives the opportunity to enter, but it is likely to target 135548 of the price after the weekly candle closure that may be over 123218. On the other hand, the downward breaking of the Breaker Block region, which is seen with pink color in the graph, may cause the price to fall into the Order block area with blue. The downward breaking of this region may cause a decrease to the Gray FVG area, and even the next Order Block region. NOTES: 1-) Different FVG regions are also available in the graph, some faakat some of them overlap with other Block regions or because they will overlap with other drawings that will cause image pollution in the graph. 2-) New formations may occur as the time progresses. These should be meticulously followed. I wish you good earnings ...
