Technical analysis by ULYSSESTRADER about Symbol FET: Sell recommendation (8/18/2025)

ULYSSESTRADER
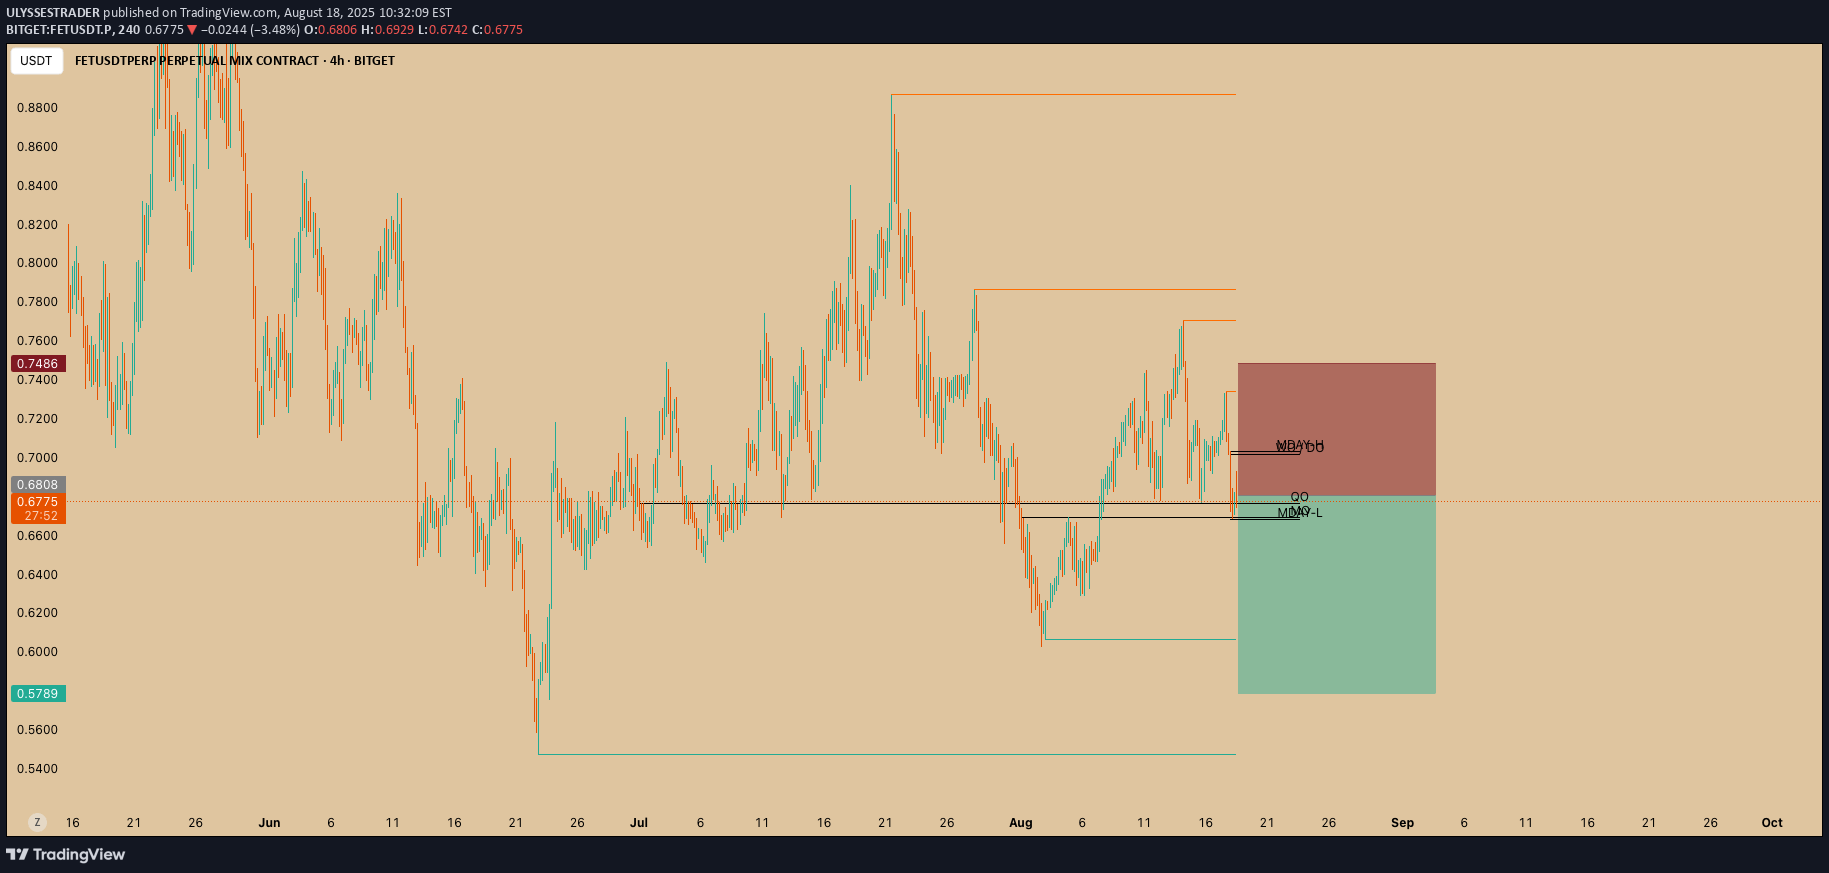
1. Chart Type & Pair Pair: FET/USDT Perpetual (Bitget) Timeframe: 4-hour (H4) Type: Candlestick chart 2. Main Levels Marked MDY-H → Mid-day high MDY-L → Mid-day low QQ → Likely a liquidity or equilibrium zone Weekly/Monthly Highs & Lows also appear marked in orange (higher time-frame S/R). 3. Trade Setup Entry Zone: Around current price (~0.6775 USDT) Stop Loss (SL): Just above 0.74 – 0.75 USDT (red zone). This protects against upside invalidation. Take Profit (TP): Around 0.58 USDT (green zone). This targets the lower liquidity sweep/weekly low. So this is a short (sell) setup. 4. Risk-to-Reward (R:R) The red box = risk area (loss if price goes above resistance). The green box = reward area (profit if price drops). Visually, this looks like around 1:3 R:R, which is a solid short setup. 5. Strategy Logic Price is retesting resistance around 0.68 – 0.70. The trader expects rejection from this zone, leading to a move back down to 0.58. The stop loss above 0.74 means if buyers push higher, the trade idea is invalid. ✅ In summary: This is a short trade setup on FET/USDT expecting rejection near current levels (0.68) with a downside target at ~0.58. The trade uses a tight stop above resistance at ~0.74 for good risk/reward.
