Technical analysis by EconomicanalysAbdulRahman about Symbol ETH on 8/18/2025

EconomicanalysAbdulRahman
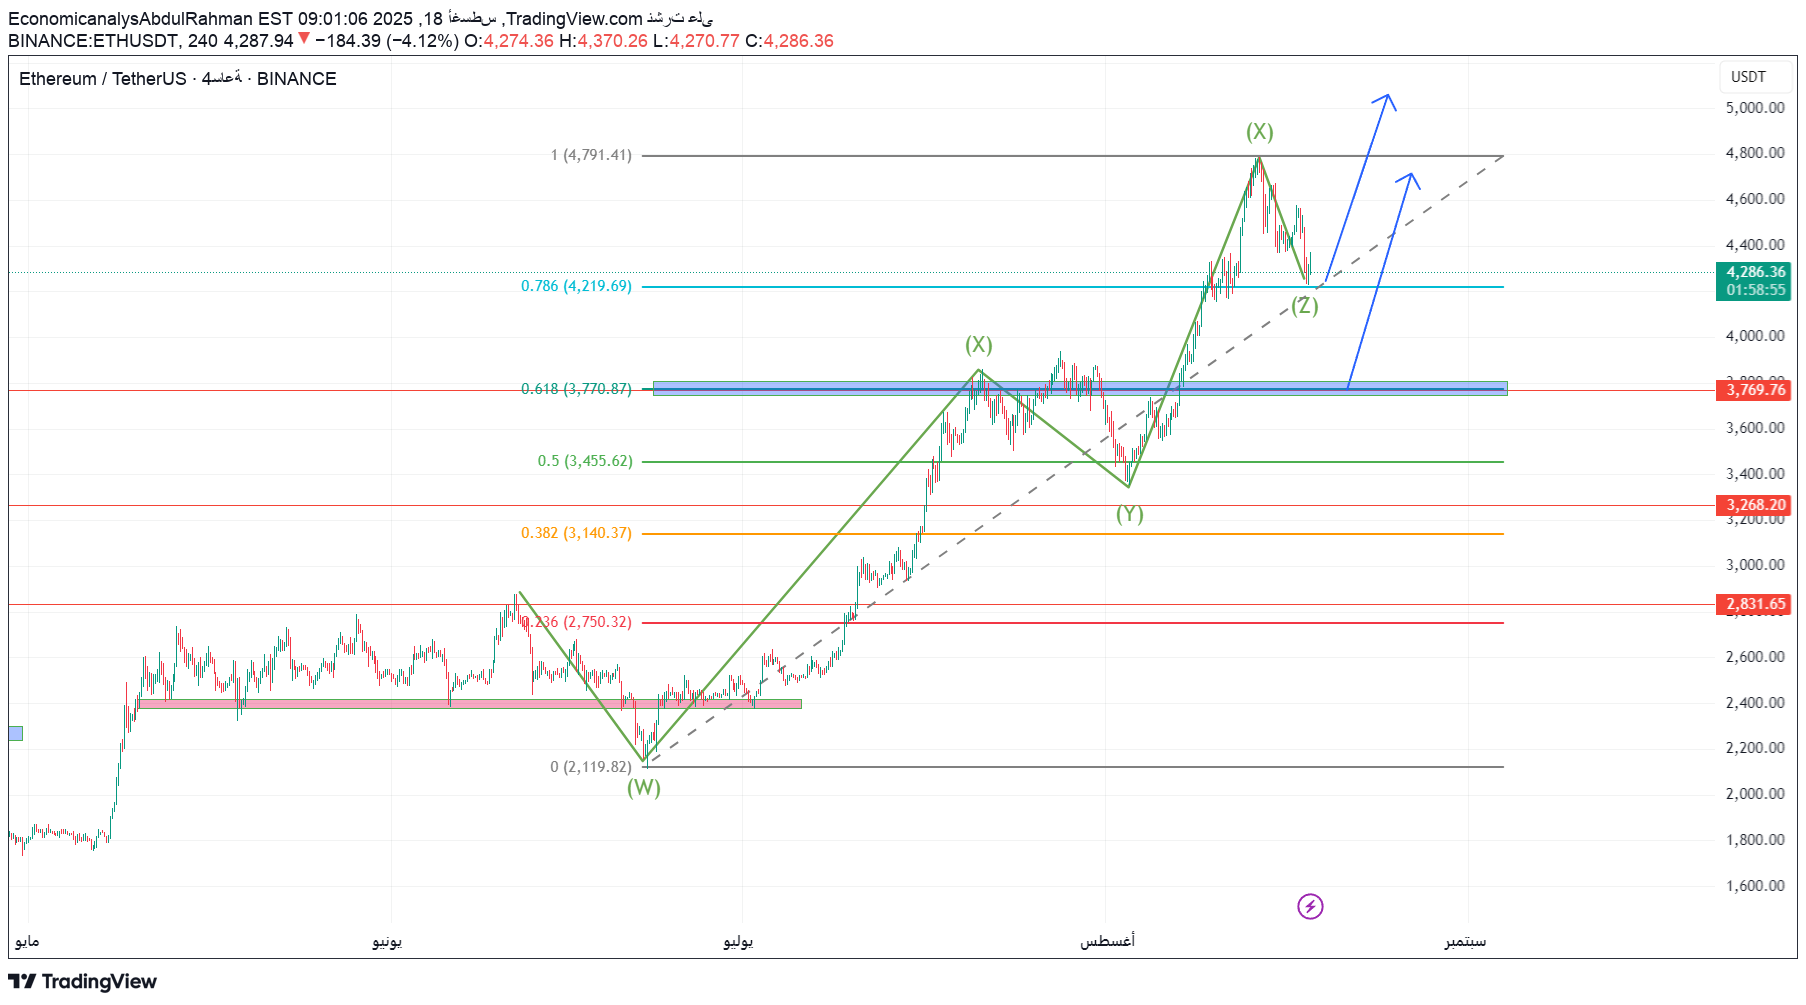
Technical Analysis ETH/USDT - corrective waves (wxyxz) Time frame: 4 hours Stock Exchange: Binance Artistic description The price shows the formation of a complex Correeding model of the type of Triple Three Wxyxz after a strong wave of climb. The last (<0) wave was complete at the top near $ 4,700, and the price began to land in the target (Z) wave. We expect the correction to continue towards major support levels. Important technical levels: First support: $ 3,944 Second support: $ 3,695 Third support: $ 3,268 Main support: $ 2,831 The expected scenario: The decline in the wave continues to target the area between $ 3,944 - $ 3,695 as a possible apostasy area. In the event that the $ 3,695 level is broken with a strong closure, the landing extends up to $ 3,268. The scenario remains existing as long as the price is below the last top level at $ 4,700. Trading plan: Selling (Short): between 4,300 - 4,400 The first goal: $ 3,944 The second goal: $ 3,695 The third goal (extens): $ 3,268 Stop Loss: Close the top of $ 4,700 Additional technical signal: Fibonacci 61.8% intersects with $ 3,950, which enhances support strength. Monitor the price behavior at each level to confirm the bounce before thinking about buying. 📉 General view: negative in the short term until the wave (Z) is complete, then we are awaiting a reflection signal for ascension.
