Technical analysis by behdark about Symbol UXLINK on 4/3/2025

behdark
UXLINK ANALYSIS (8H)
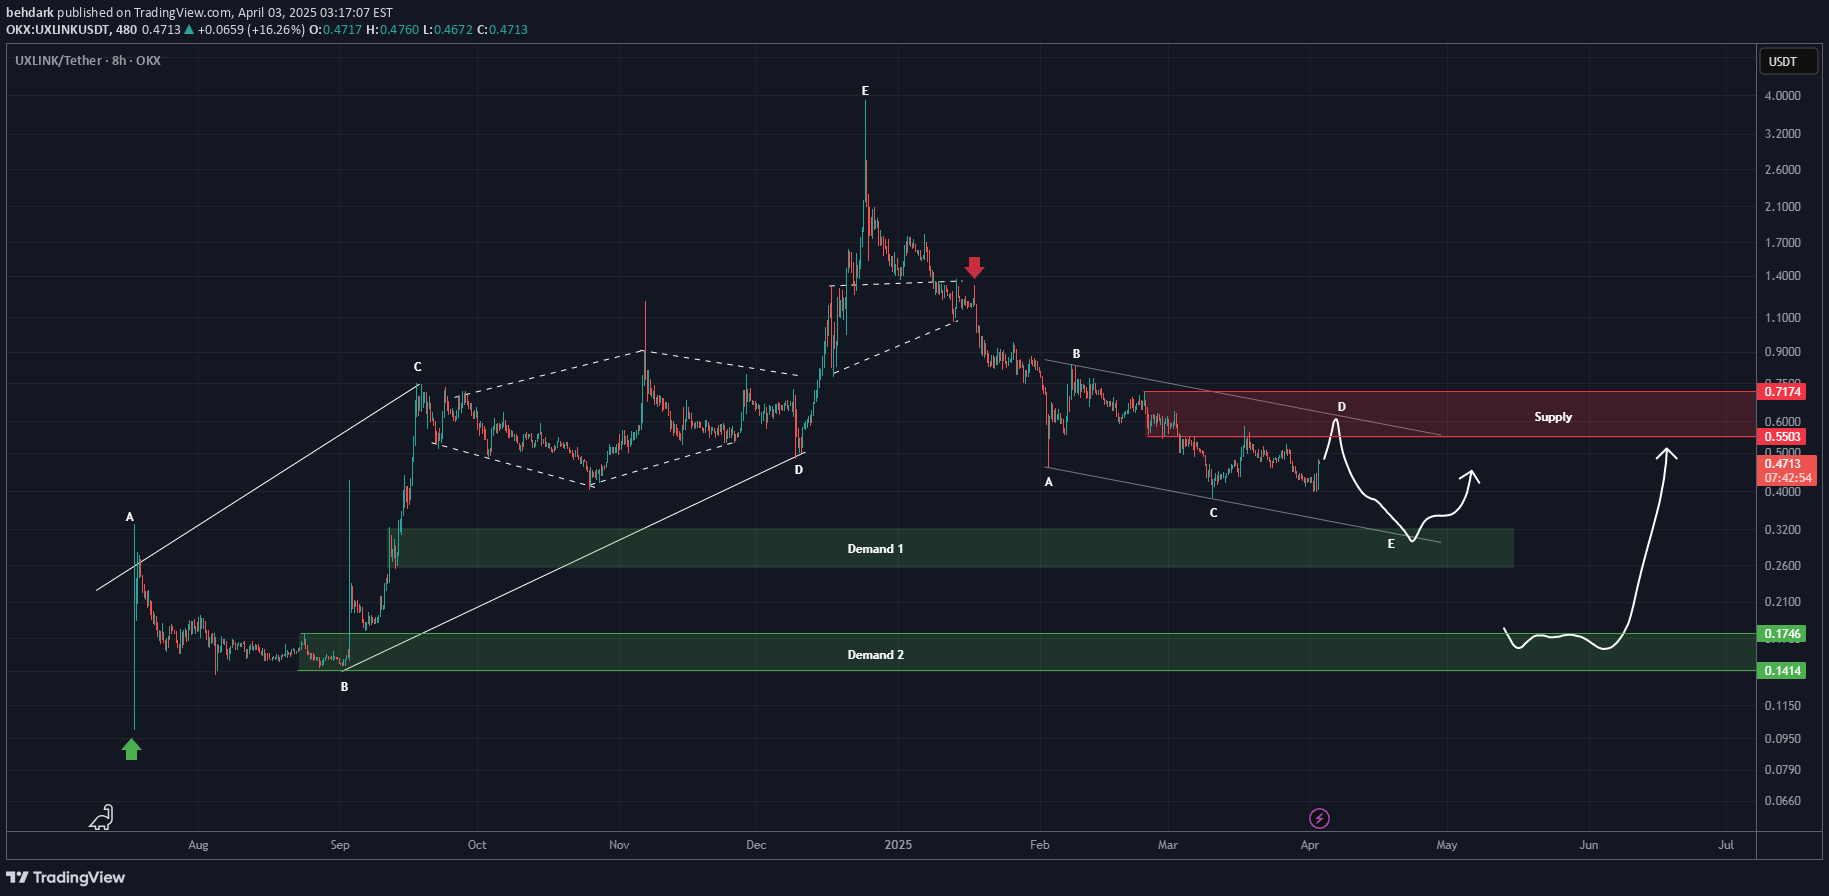
From the point where we placed the green arrow on the chart, an expanding triangle began, and the pattern completed at the point where we placed the red arrow. Now, the price seems to be in a correction, which appears to be either a Diametric or Symmetric pattern. Currently, it looks like we are in wave D of this structure. We expect a drop from the red box. Demand 1 is a temporary rebuy zone, while Demand 2 is a suitable area for a set-and-forget approach with good gains. Let's see what happens! For risk management, please don't forget stop loss and capital management When we reach the first target, save some profit and then change the stop to entry Comment if you have any questions Thank YouIt pumped and reached the red zone, then got rejected as per the previous analysis this scenario is playing out.Eventually, the drop occurred and the price reached the green zone, showing a reaction. Since hitting the green zone, it has pumped over 44%. The path was accurately mapped out.