Technical analysis by Lingrid about Symbol PAXG: Buy recommendation (8/17/2025)

Lingrid
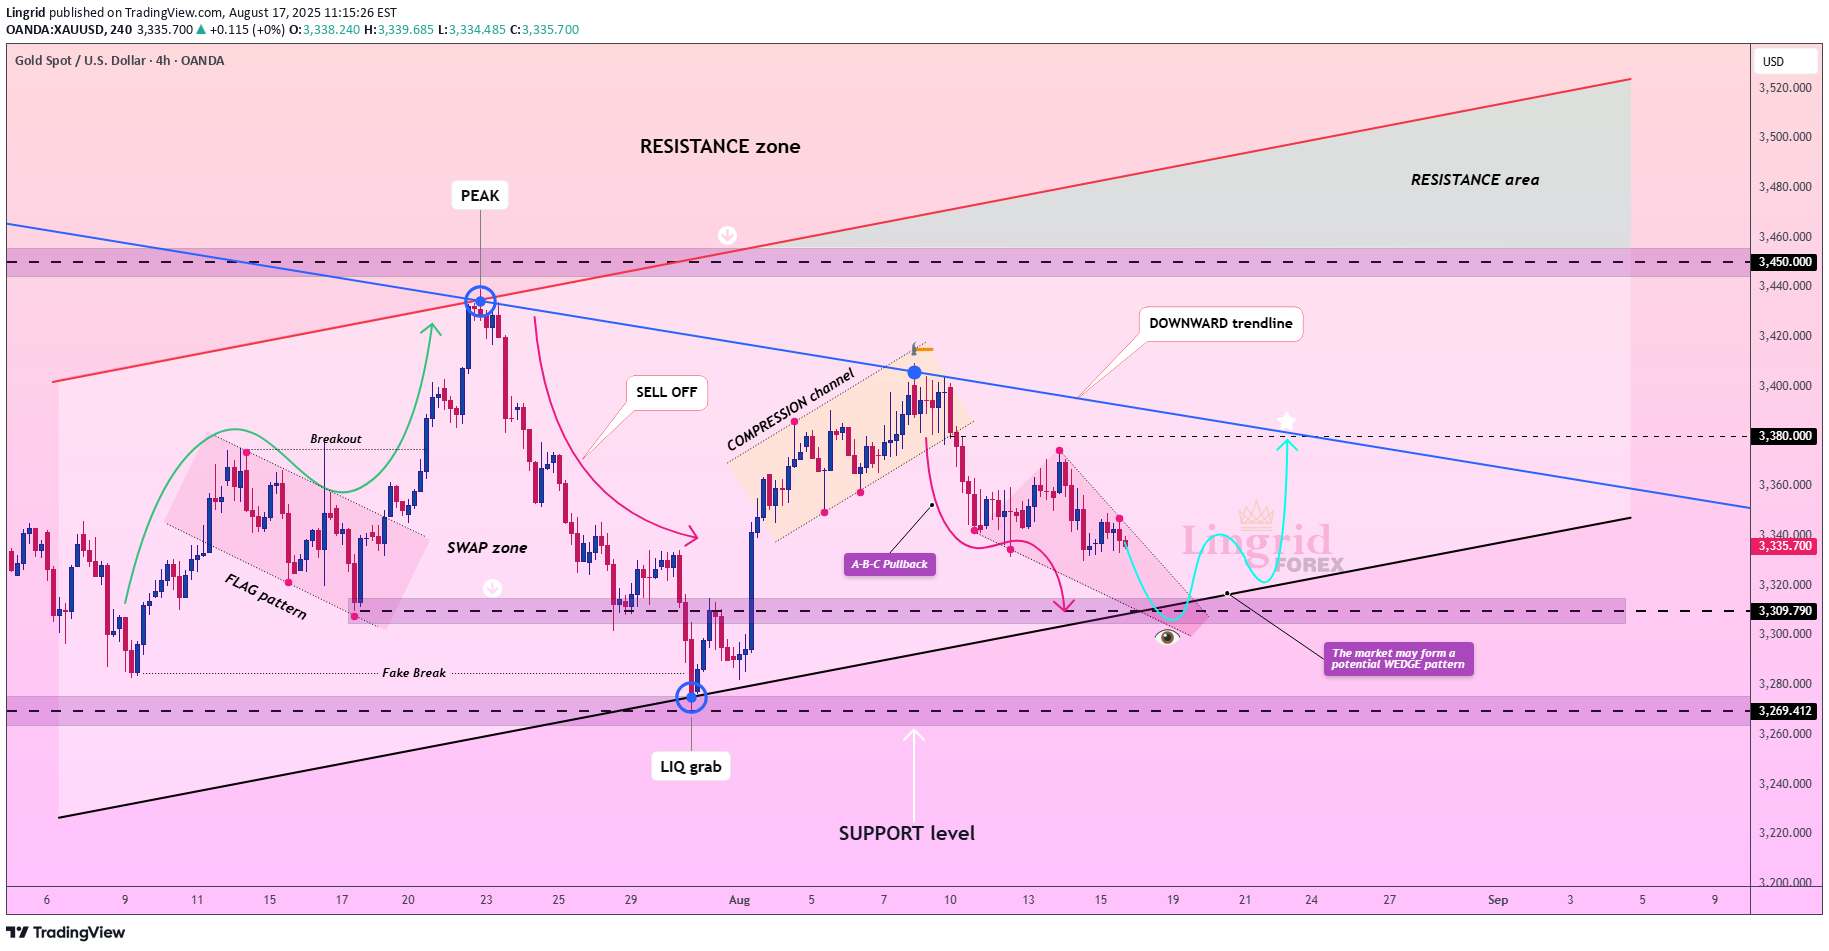
XAUUSD has pulled back from recent highs, currently around $3,335 after touching peak levels near $3,450. The pullback appears to be testing key support structures within a broader consolidation phase following the earlier breakout attempt. 4H chart shows a complex technical picture with gold trapped between the resistance zone around $3,450 and critical support near $3,270. The recent price action shows characteristics of an A-B-C corrective pullback within a compression channel, with a potential wedge formation visible in the latest consolidation phase. Key technical levels include the downward trendline acting as dynamic resistance and the ascending support line providing a floor around current levels. The recent low near $3,270 suggests institutional players may be testing liquidity zones before establishing larger positions. Market participants should monitor the $3,310 swap zone level closely, as a break below could signal deeper retracement toward the $3,280 zone. Conversely, reclaiming the $3,380 resistance would suggest renewed bullish momentum targeting the upper resistance area. The current consolidation phase represents a healthy pause after the previous advance, with buyers likely to emerge on any significant dip toward major support levels. Volume and momentum indicators will be crucial in determining whether this pullback represents a temporary correction or a more significant trend shift. If this idea resonates with you or you have your own opinion, traders, hit the comments. I’m excited to read your thoughts!XAUUSD has pulled back after rejecting the resistance peak and is now consolidating around the support zone. A compression channel and A-B-C pullback are formed, with a flag-like structure suggesting a potential bullish continuation. If buyers defend the 3,310 support region and break the descending structure, price could extend back toward 3,385. Momentum context shows a repeating flag breakout pattern similar to mid-July, which supports a bullish setup if demand holds. 📉 Key Levels: - Buy trigger: rejection of 3,310–3,320. - Buy zone: 3,310–3,320 support zone. - Target: 3,385 resistance retest. - Invalidation: Breakdown below 3,300 invalidates the bullish setup. 💡 Risks: - Failure of the current flag pattern could extend the downtrend toward deeper supports. - Broader downward trendline remains a structural resistance overhead. - Macro catalysts (Fed policy signals or inflation data) may trigger volatility against the setup.
