Technical analysis by AlexeyWolf about Symbol PAXG on 8/17/2025

AlexeyWolf

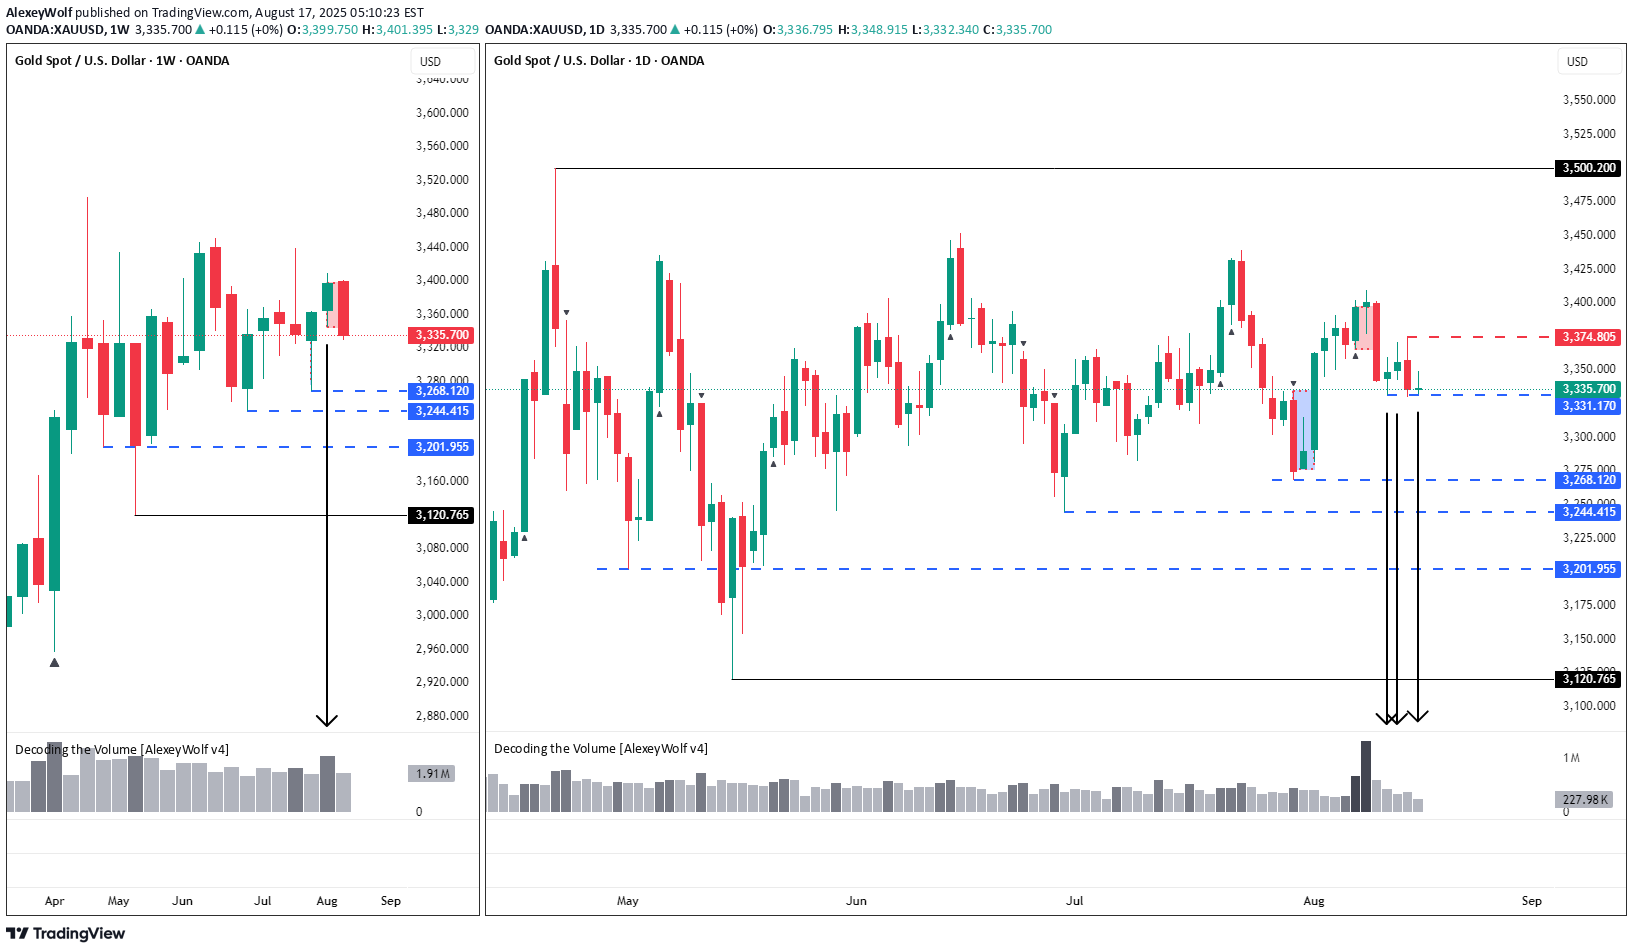
Hi traders and investors! This analysis is based on the Initiative Analysis concept (IA). Weekly timeframe On the weekly timeframe, we see a buyer’s initiative, but at the same time, the seller absorbed a strong buyer candle — with the highest volume in recent months — and formed a seller zone (marked with a red rectangle). That’s a negative sign for long entries and a potential setup for short entries from the seller’s zone. Below, the weekly chart shows three important levels: 3268, 3244, and 3201. I expect the price to move down toward 3244, where there is likely more liquidity (possibly with a touch of 3201). That’s where we can start looking for buy patterns. Daily timeframe On the daily timeframe, we have a sideways market and a seller’s initiative now, with a target at 3154. The buyer tried to start a move from the buyer zone (blue rectangle), but both candles had declining volume, and the second candle failed to close above the first one. That’s a negative sign for long entries. Friday’s buyer candle also had low volume and showed no result — That’s a negative sign for long entries too. With a seller’s initiative in place and no real buying signals, we’re focusing on short opportunities. Hourly timeframe On the 1H chart, the price has formed a sideways range with a buyer’s initiative. The lower boundary of this range is at 3331, where we saw price interaction on declining volume — a negative sign for long setups. I expect price to interact with 3329, after which a buyer move is possible (unlikely, but possible). The target is 3358. Wishing you profitable trades!