Technical analysis by ManiMarkets about Symbol BTC: Buy recommendation (8/16/2025)

ManiMarkets
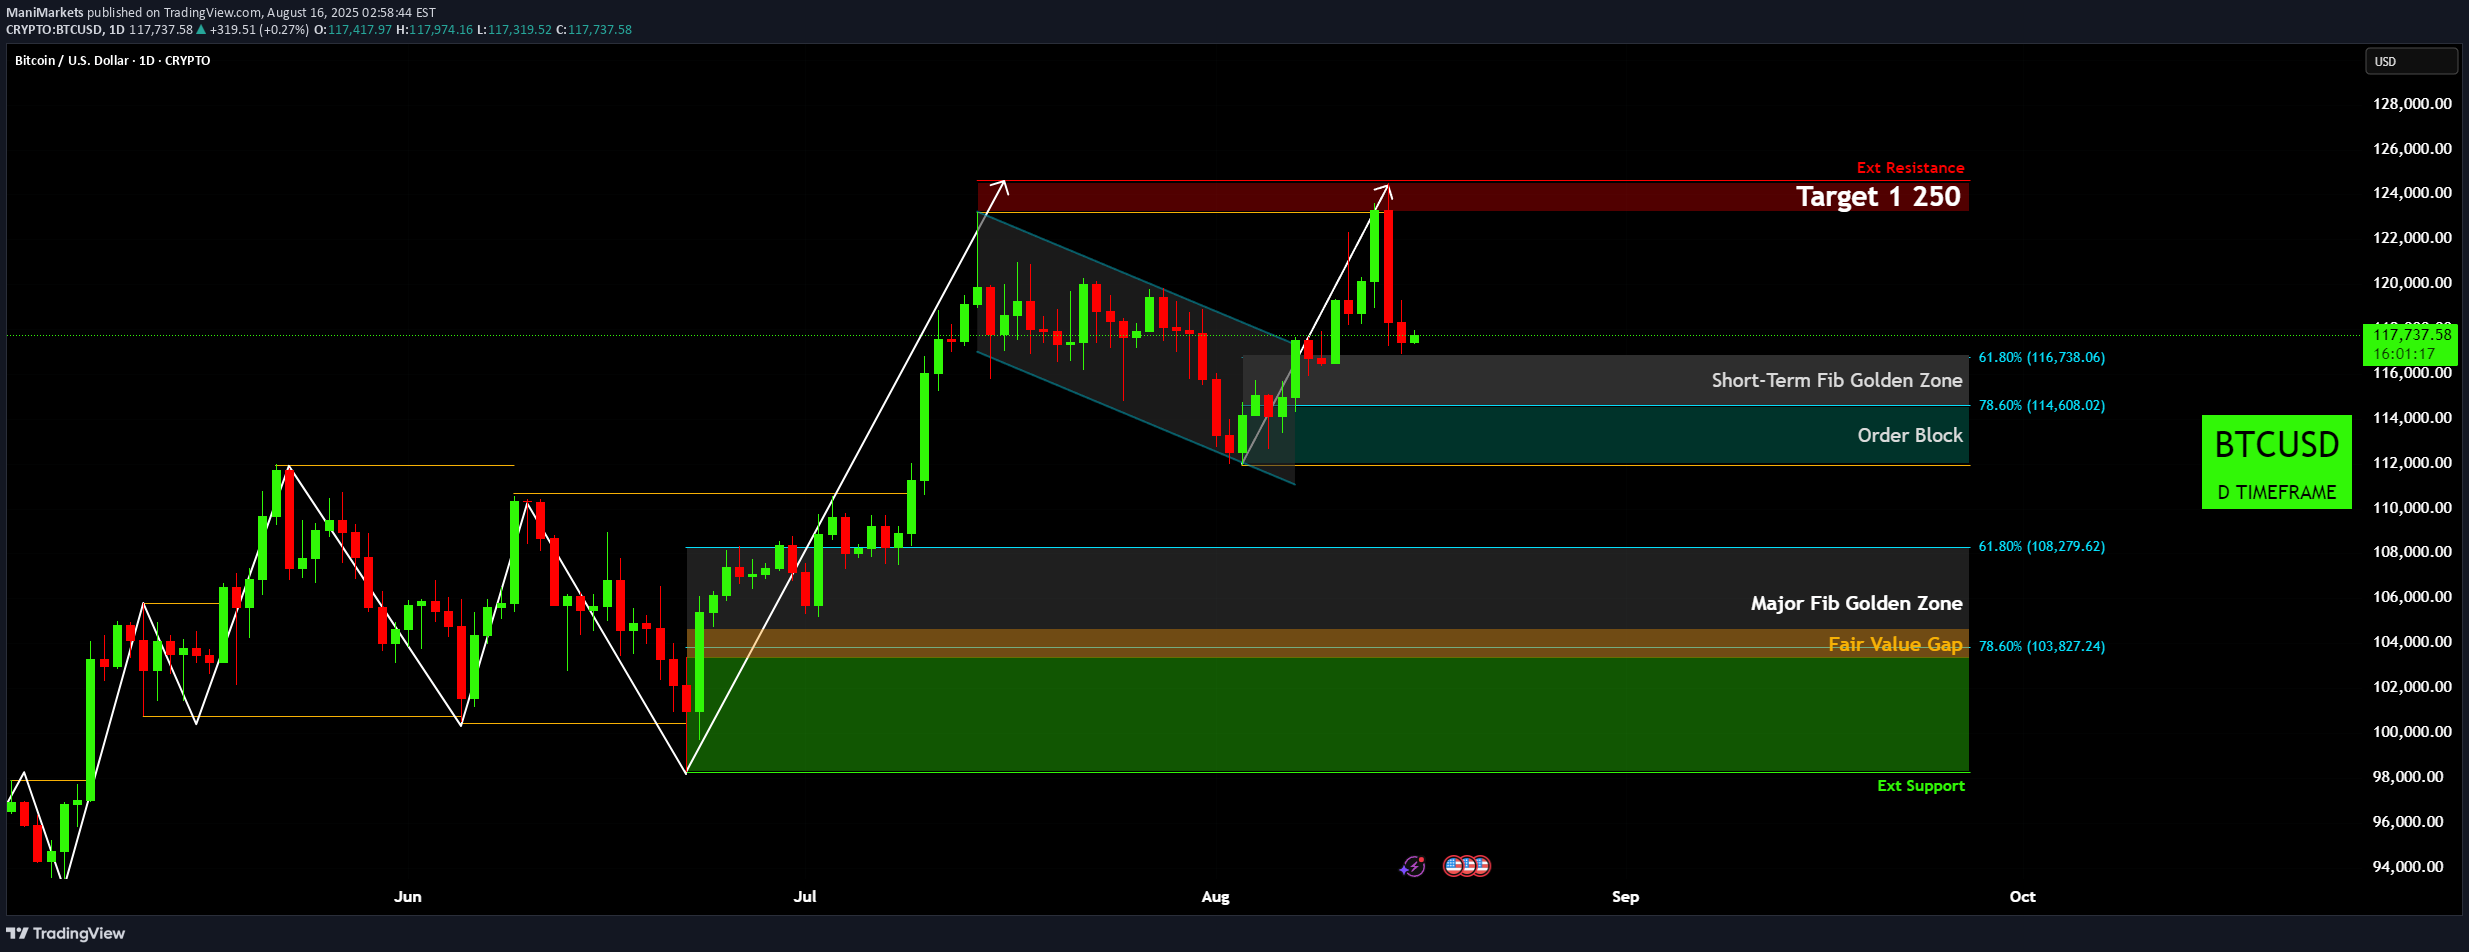
The Bitcoin chart reveals a significant technical pattern that traders should be watching closely. After a strong run-up, we are seeing the asset face considerable resistance, forming what appears to be a double-top structure near the $124,000 level. 📈 This price action suggests a potential reversal or a substantial pullback before any further upward continuation. Bitcoin is currently trading within a short-term Fib Golden Zone , a critical area for bulls to defend. 🛡️ This zone spans between the 61.8% ($116,730) and 78.6% ($114,500) Fibonacci retracement levels. A decisive break below this range could signal a deeper correction. Beneath the short-term support, there is a key "Order Block" that could act as the next line of defense for the bulls. 🧱 This area, typically marked by institutional buying interest, is a high-probability reversal zone. A more significant test for Bitcoin's strength lies in the "Major Fib Golden Zone" and the "Fair Value Gap" below the current price. 🎯 This area, roughly between $108,000 and $103,000, represents a confluence of strong technical support. A drop into this zone would be a healthy retracement to re-test prior support levels before attempting a new leg up. Failure to hold the key support levels and a breakdown below the Major Fib Golden Zone could see the price seeking a deeper floor towards the "Ext Support" level, near the $96,000 mark. 📉 This would invalidate the recent bullish structure and open the door for a more prolonged bear market. Disclaimer The information provided in this chart is for educational and informational purposes only and should not be considered as investment advice. Trading and investing involve substantial risk and are not suitable for every investor. You should carefully consider your financial situation and consult with a financial advisor before making any investment decisions. The creator of this chart does not guarantee any specific outcome or profit and is not responsible for any losses incurred as a result of using this information. Past performance is not indicative of future results. Use this information at your own risk. This chart has been created for my own improvement in Trading and Investment Analysis. Please do your own analysis before any investments.
