Technical analysis by CryptoNuclear about Symbol FET: Buy recommendation (8/16/2025)

CryptoNuclear
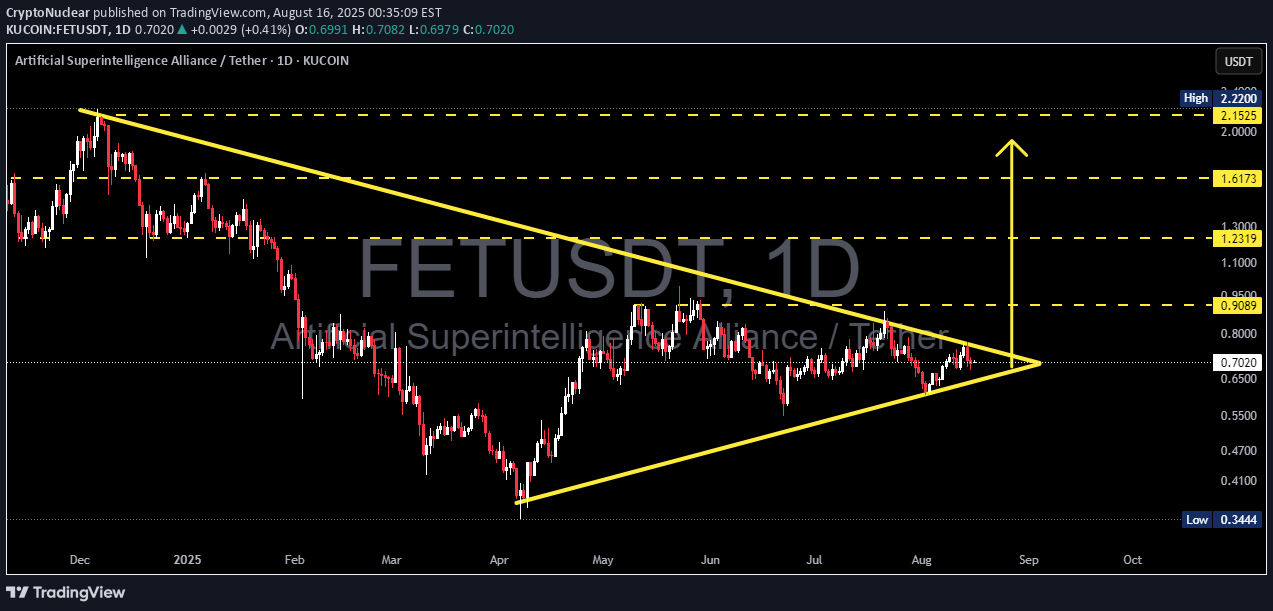
Summary The FET/USDT (1D) chart is forming a symmetrical triangle — a consolidation pattern where descending highs and ascending lows converge. Price is trading around 0.7020 inside a tight range, with volatility shrinking as it approaches the apex. Major resistance levels are 0.9089, 1.2319, 1.6173, 2.2200, while the key support lies at 0.3444. --- Pattern Explanation Pattern Name: Symmetrical Triangle. Nature: Neutral; direction depends on breakout confirmation. Context: Formed after a strong downtrend (Dec–Apr) followed by higher lows since April, suggesting possible accumulation. Key Point: Breakout/breakdown probability increases as the price nears the apex. Always confirm with volume. --- Measured Move Projection Triangle height: 2.2200 – 0.3444 = 1.8756. Breakout projection from ~0.7020 = 2.5776 (long-term measured move target). Realistically, price will face major resistances first: 0.9089 → 1.2319 → 1.6173 → 2.2200. --- Bullish Scenario Confirmation: Daily close above descending trendline and ideally 0.9089. Volume expansion above average. Retest of breakout zone turning into support. Targets: Conservative 1: 0.9089. Conservative 2: 1.2319. Aggressive: 1.6173 → 2.2200 → measured move ~2.58. Trading idea: Aggressive: enter on breakout with stop loss below breakout candle (~<0.65). Conservative: wait for breakout + retest above 0.9089, enter on retest. --- Bearish Scenario Confirmation: Daily close below ascending trendline. Volume spike on sell-side. Retest failure of broken support as resistance. Targets: Initial target: 0.3444. Extended bearish levels: 0.30 → 0.20 if momentum accelerates. Trading idea: Short on retest after breakdown or enter on close confirmation. Stop loss above retest level (e.g. >0.75 if breakdown occurs around 0.70). --- Key Notes / Risk Management Watch volume for confirmation, avoid fakeouts. Confluence with indicators: RSI, MACD, MA 50/200. Manage risk: use stop loss, avoid overexposure (1–3% per trade). Keep an eye on fundamentals or project-related news that could trigger sudden volatility. --- FET/USDT — forming a Symmetrical Triangle near the apex. A breakout above 0.9089 with strong volume could target 1.23 / 1.62 (ext. 2.22 → measured ~2.58). Breakdown below the rising support risks a drop toward 0.344. Always wait for confirmation and manage risk. #FETUSDT #FET #CryptoAnalysis #TrianglePattern #Breakout #AltcoinAnalysis #SupportResistance #CryptoTrading #TechnicalAnalysis
