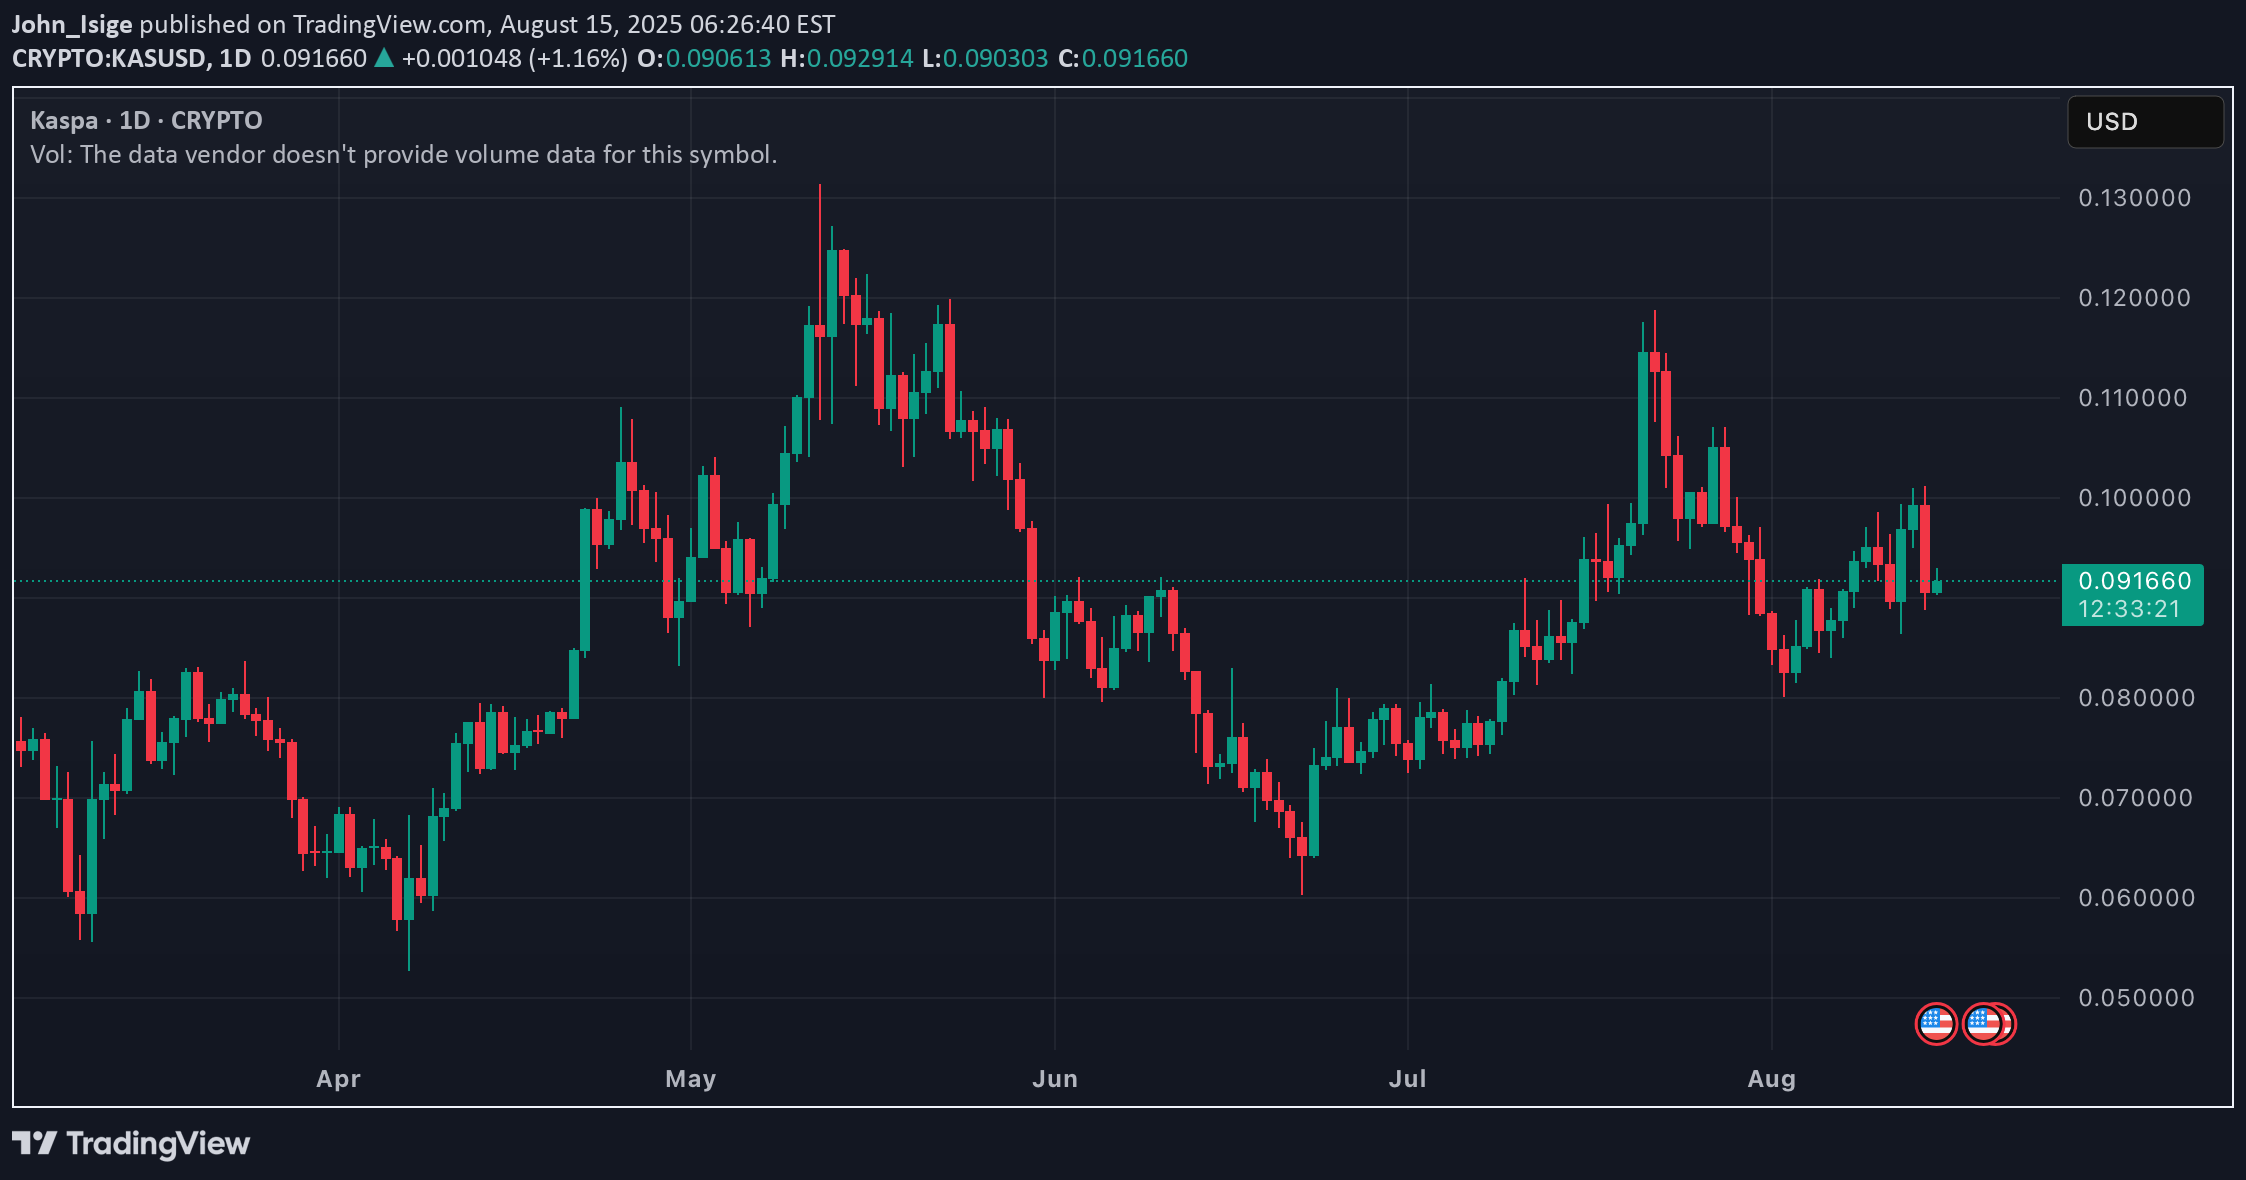
Technical analysis by John_Isige about Symbol KAS on 8/15/2025

KAS is stuck in a sideways grind just above its 200-day SMA. $0.10 remains the wall to beat — can bulls break through or will $0.085 give way first? Kaspa (KAS) price remains trapped in a tight range, holding just above the 200-day SMA... Kaspa (KAS) price remains trapped in a tight range, holding just above the 200-day SMA but repeatedly failing to clear the $0.10–$0.105 resistance zone. Since peaking at $0.118 in July, KAS has been stuck between key support and resistance levels, now trading at $0.08956 (-9.37% in the last 24h). The descending trendline from April’s $0.125 high, connecting to July’s $0.118 peak, is still capping upside moves. Support at $0.085 has held multiple times since late July; losing it could bring $0.080 back into play. ⸻ Daily Overview (August 15): • Current Price: $0.08956 • RSI (14): 48.70 – neutral • MACD: mild bullish momentum • ADX: 29.07 – strong but bearish trend • CCI: 61.90 – leaning bullish • ROC: 2.664 – positive change • Bull/Bear Power: 0.0028 – slight buyer edge ⸻ Bullish scenario: A breakout above $0.10 could target $0.105–$0.110, with a possible extension to $0.118–$0.120 if momentum accelerates. Neutral scenario: Price stays between $0.085 and $0.10 until a catalyst sparks a move. Bearish scenario: A daily close under $0.087 could lead to $0.084–$0.085, with $0.080 as the next support. ⸻ Chart Notes: • Resistance: $0.10, $0.105, $0.110 • Support: $0.085, $0.080 • Descending trendline from April high still in control. • 200-day SMA acting as a critical floor for buyers.
