Technical analysis by SupertradeOfficial about Symbol PAXG: Sell recommendation (8/15/2025)

SupertradeOfficial
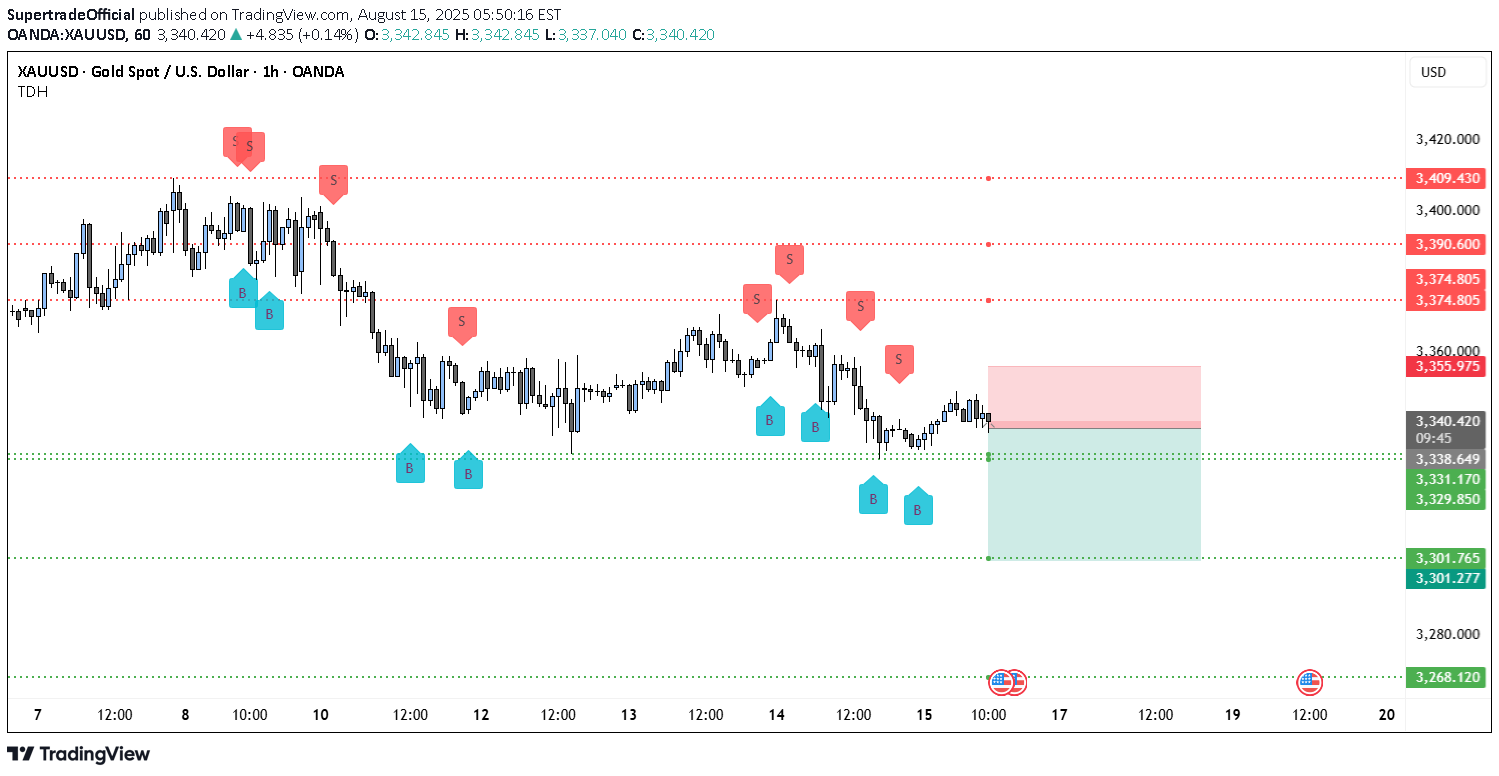
Price has been trending lower since the left side of the chart, shifting from a distribution top into a sequence of lower highs and lower lows. After the failed rally into the mid-chart, sellers re-asserted control and the market is now compressing under a local supply shelf. The last several candles hover around ~3,338 with shallow bounces and repeated rejections—typical of a market leaning heavy into support rather than springing from it. The key battleground is the 3,331 zone (two green dotted prints around 3,331.17 / 3,329.85). It has acted as a base multiple times, but every touch is coming from lower highs, which increases the odds of a breakdown. Beneath that, a clean air pocket runs to 3,301.28–3,301.77 (next green level), and if momentum extends, the measured downside points toward 3,268.12 at the bottom of your map. On the topside, supply stacks up tightly: intraday cap at 3,355.98–3,360.00, then higher resistance shelves at 3,374.81, 3,390.60, and 3,409.43 (all marked with red dotted lines). The clustering of red “S” markers around the 3,355–3,375 area reinforces that zone as distribution/sell interest. Market structure confirms the bearish bias: each rally attempt is getting sold earlier (progressively lower swing highs near ~3,360 → ~3,350), while the base at 3,331 is getting probed more often. That’s classic compression into support. The small-bodied candles near current price show lack of aggressive buying; wicks on the upside into ~3,345–3,355 keep getting faded. The green “B” markers that appeared on recent dips have not driven a higher high, which weakens their signal and suggests they’re catching falling knives inside a down-structure. A quick invalidation map helps frame risk: any 1H close back above 3,360 would neutralize the immediate short idea and expose a squeeze toward 3,374.8, and only then would 3,390.6 → 3,409.4 come back into play. Until that reclaim, the path of least resistance remains down, with liquidity likely resting below 3,329–3,331. Trade Setup (bearish) •Option A — Breakdown Play: Sell the decisive break and 1H close below 3,331, or short a retest of 3,331–3,334 from underneath. Stop: above 3,356–3,360 supply. Targets: 3,301 first, stretch to 3,268 if momentum persists. •Option B — Fade the Rally: If price bounces into 3,352–3,360 supply, look for rejection wicks to short. Stop: above 3,374.8 (next resistance shelf). Targets: 3,331 initial, then 3,301; leave a runner toward 3,268. Risk notes: avoid chasing the very first tick below 3,331—gold often does a quick sweep before the real move. If a sweep below 3,331 snaps back inside the range and closes above the level, step aside; that’s a trap. Once the first target is hit, consider taking partial profits and trail the stop above the most recent 1H lower high to stay aligned with the down-trend. Economic calendar icons on the chart suggest upcoming USD events—expect spikes; keep sizing modest until after prints.
