Technical analysis by readCrypto about Symbol ETH on 8/14/2025

readCrypto
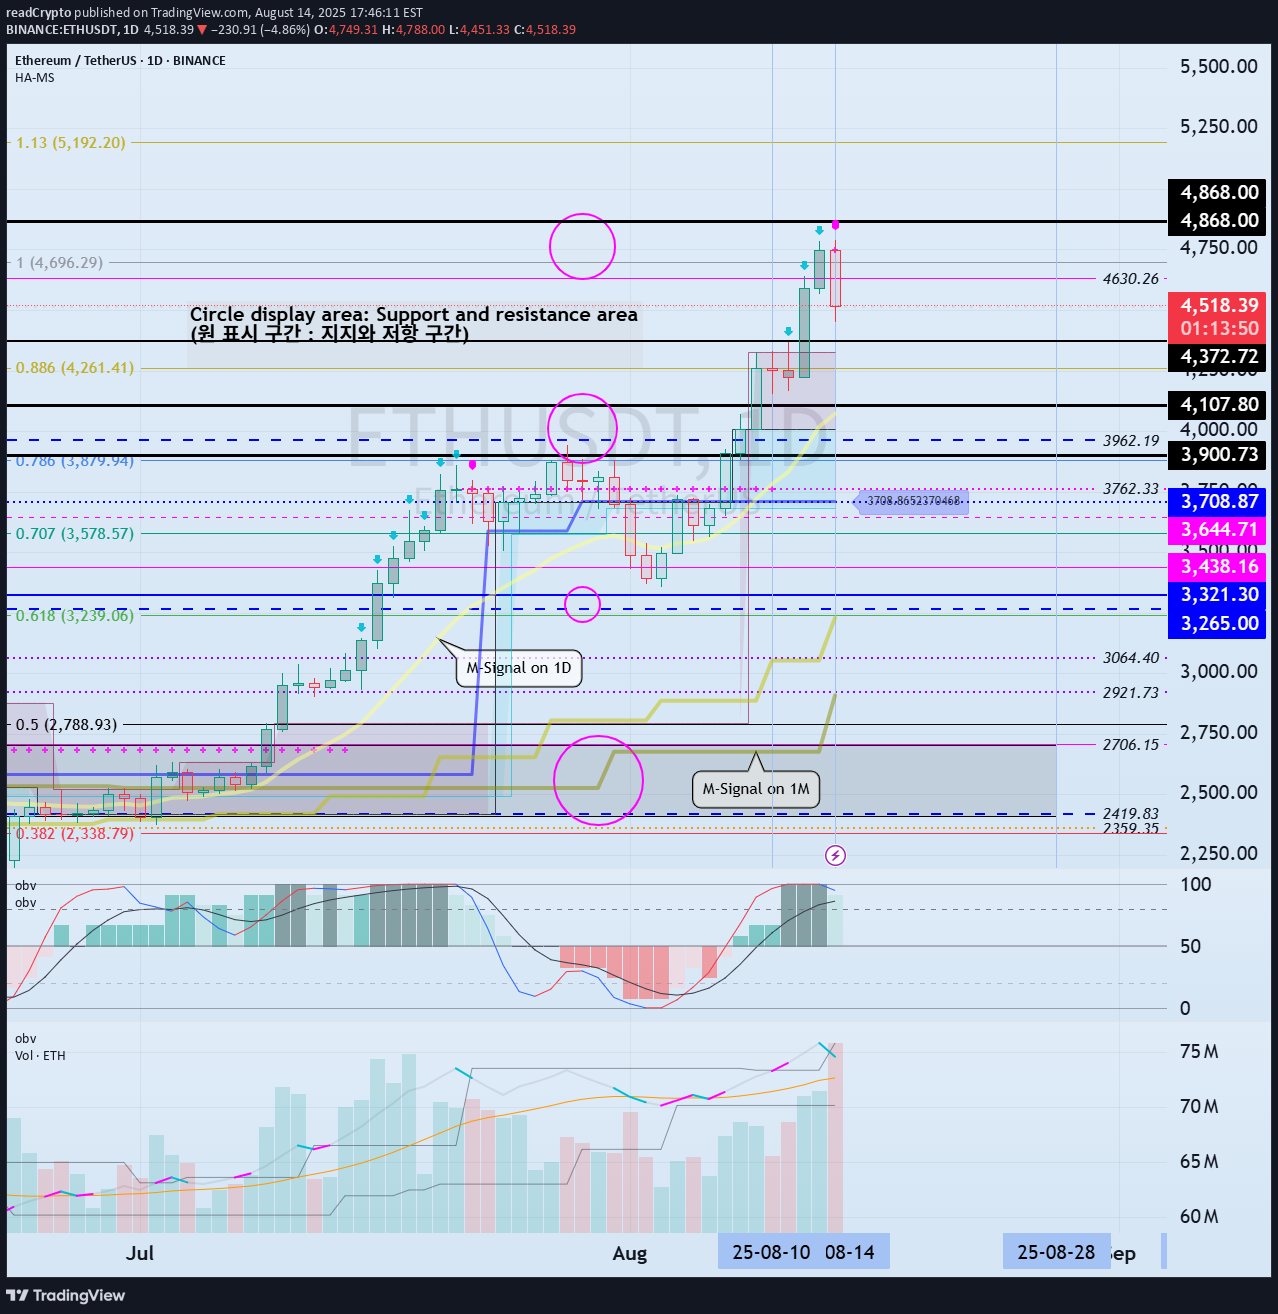
Hello, traders! Follow us to get the latest information quickly. Have a great day! ------------------------------------- (ETHUSDT 1D chart) This volatility period for ETH is expected to last until August 15th. Therefore, caution is advised when trading. The key question is whether the price can rise above the previous all-time high (ATH) of 4868.0. Currently, the key support and resistance levels are 3900.73-4107.80. Therefore, even if there is a further decline, if the price remains within the 3900.73-4107.80 range or higher, the upward trend is expected to continue. Currently, the HA-High indicator is formed at 3708.87, so it's important to check whether a new HA-High indicator is formed if a further decline occurs. The formation of the HA-High indicator indicates a decline from the high, so determining whether support is found near that level is crucial. While ETH's volatility period is around August 28th, BTC's volatility period is around August 24th. Therefore, it's important to monitor how the price moves during this period. - Thank you for reading. We wish you successful trading. -------------------------------------------------- - Here's an explanation of the big picture. (3-year bull market, 1-year bear market pattern) I'll explain more in detail when the bear market begins. ------------------------------------------------------#ETHUSDT If the HA-High indicator forms at 4302.41, the 4302.41-4749.30 range corresponds to the high boundary. In other words, the HA-High ~ DOM (60) range is a crucial area. To continue the cascading upward trend, the price must rise above 4749.30. A decline below 4302.41 is highly likely to trigger a downtrend. However, support may be found around the previous ATH (Anytime High) range of 3900.73-4107.80, so we need to consider a response plan. The next period of volatility is around August 28th. However, since BTC's volatility period begins around August 24th, we need to closely monitor the situation from that point onward. The StochRSI indicator is showing signs of declining from the overbought zone, and appears to have transitioned to a state where K < D. If this situation transitions to a state where OBV < OBVEMA and begins to decline, we believe a decline to the 3900.73-4107.80 range is highly likely. At this time, if the TC (Trend Check) indicator falls below zero, further declines are likely and the M-Signal indicator on the 1W chart may be encountered. In addition, volatility is likely to occur when the StochRSI indicator - falls from the overbought zone, - passes the 50 level, - rises from the oversold zone, in the above cases. Because this volatility can cause price movements in a different direction than the indicator, you should check whether there is support or resistance at the support and resistance points drawn at that point.
