Technical analysis by OsamaXCrypto about Symbol ETH on 8/14/2025

OsamaXCrypto
Ethereum(ETH/USD) Long-Term Macro Forecast – Cycle Top & Buyback
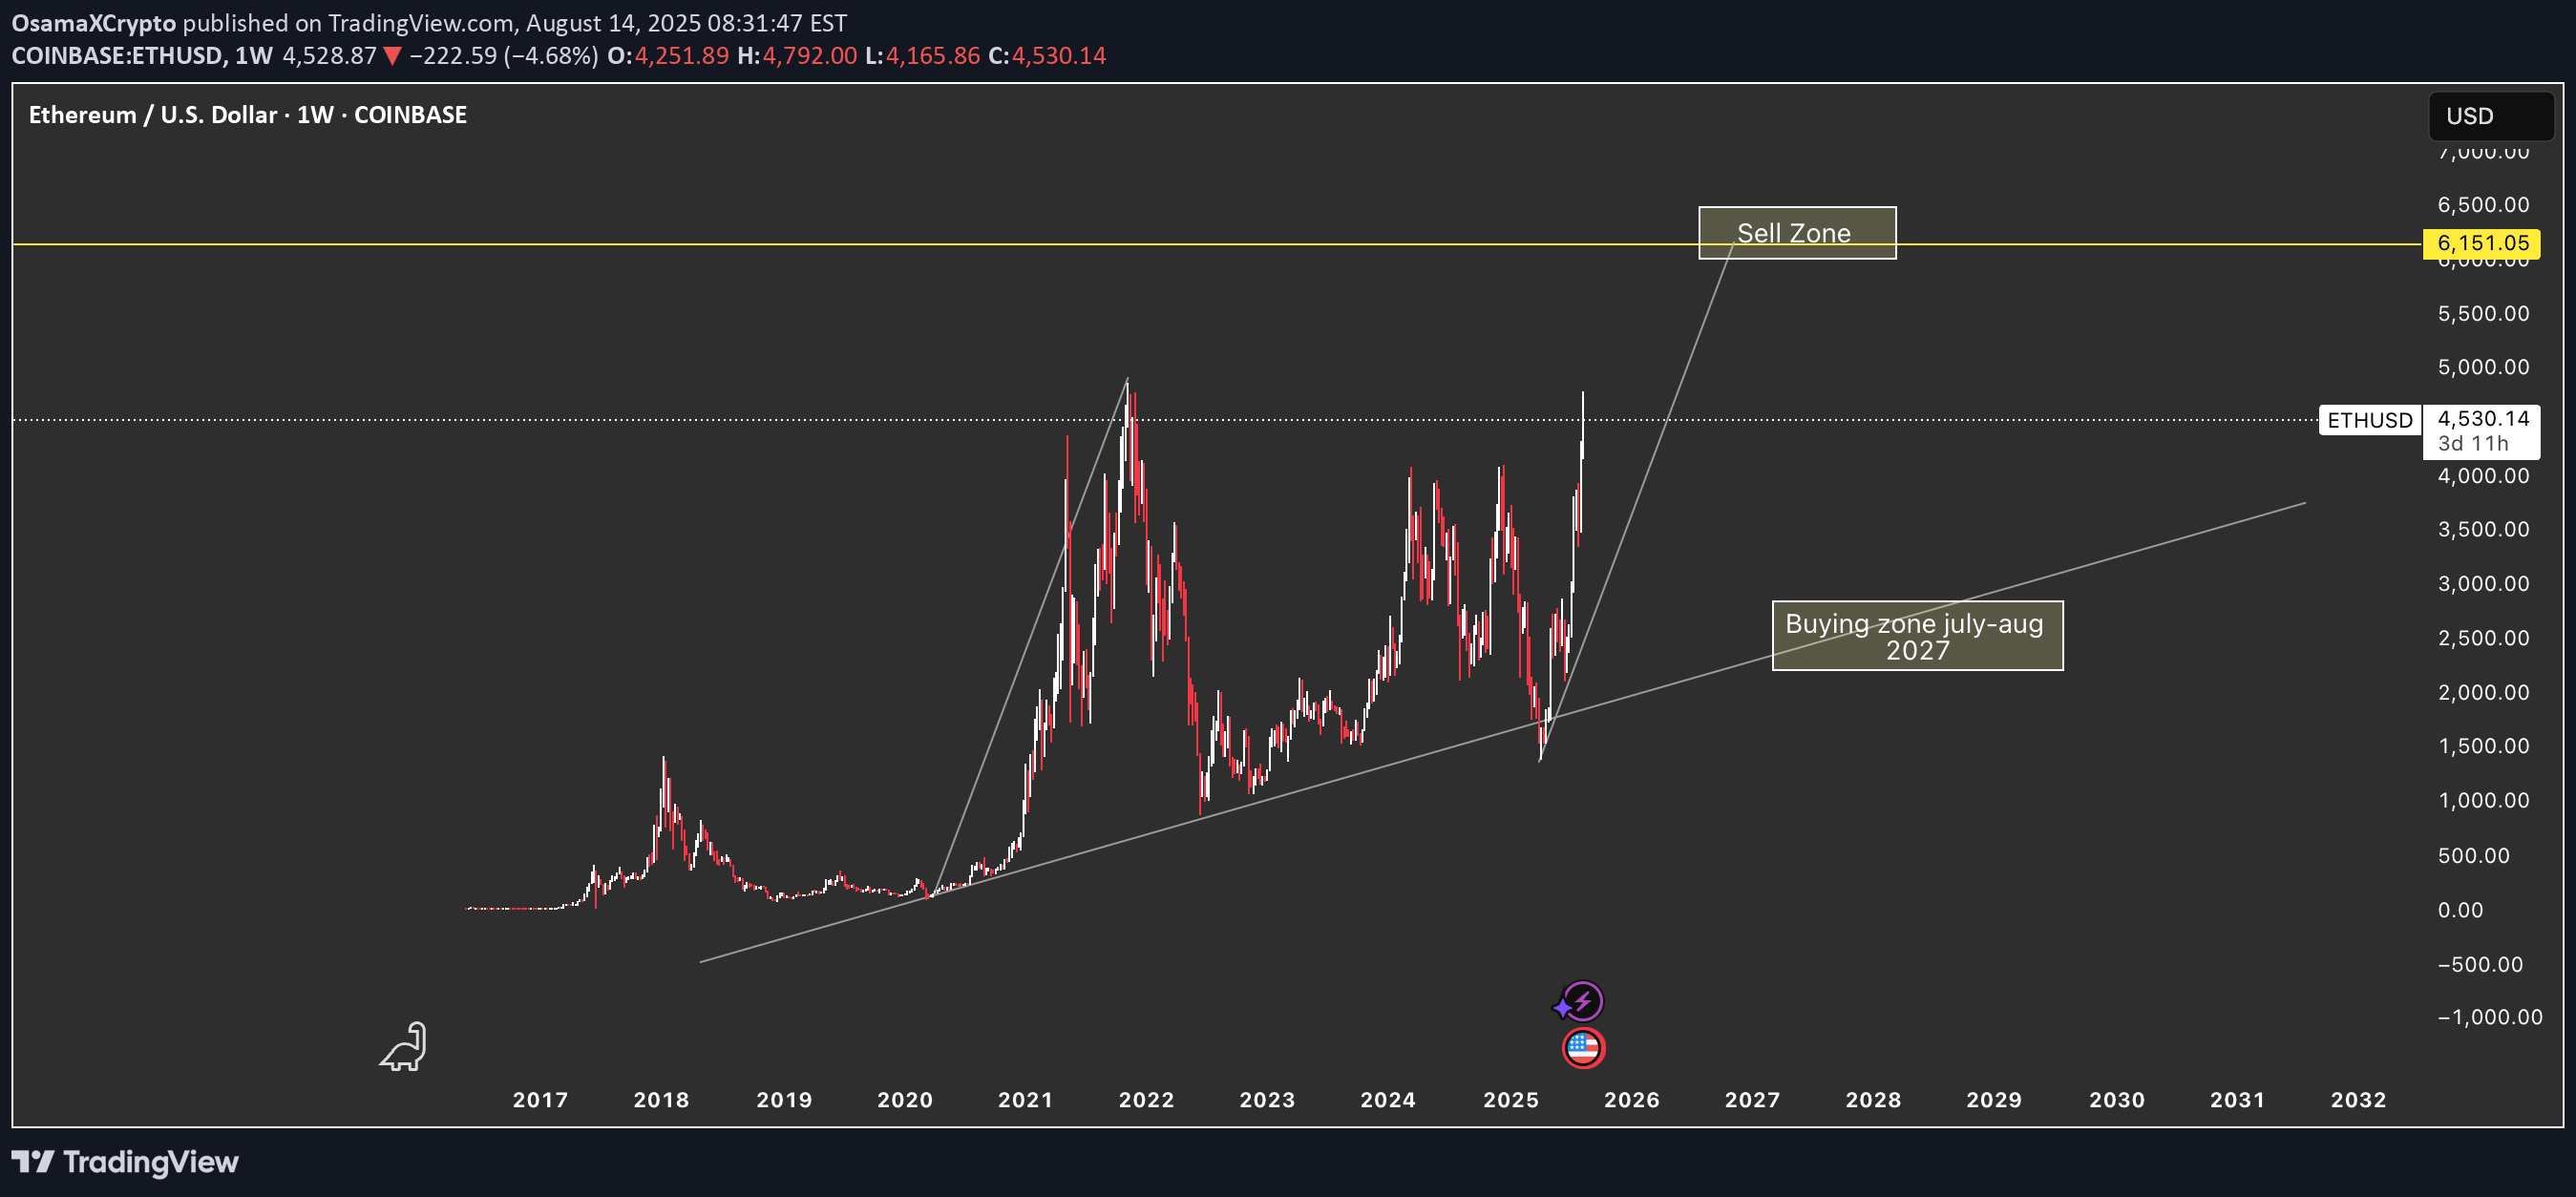
This chart outlines my macro projection for Ethereum, combining historical trend analysis, crypto cycle timing, and key support/resistance mapping. Key Levels & Timeline Sell Zone (~$6,151) – Potential cycle top for the current bull run. This target is derived from previous all-time highs (~$4,800) with a conservative extension, marking major resistance where profit-taking could be ideal. Buy Zone (Jul–Aug 2027) – Projected accumulation window after a multi-year correction. This aligns with the long-term ascending trendline that has held since 2018. Trendline Support – Drawn from 2018 lows through 2020–2022 bottoms, providing a reliable macro floor for potential re-entry. Analysis & Reasoning ETH cycles historically rally into cycle tops 2–3 years after BTC halvings, then correct 70–80% before resuming the next uptrend. This forecast assumes a strong move toward $6k–$6.5k in the current bull run, but also acknowledges the potential for overshooting to $8k–$9k if momentum and market conditions align. The July–Aug 2027 accumulation target is based on a typical 2-year post-top cooling phase, but cycles can shift ±6–12 months depending on macroeconomic and adoption factors. ETH/BTC ratio and BTC halving cycles remain key timing indicators for refining entry/exit points. Trading Approach Scale out near the $6,151 level, leave a small moonbag for possible overshoot. Accumulate again on the long-term trendline in mid-to-late 2027 for positioning into the 2029–2030 potential cycle top. 📌 Disclaimer: This is not financial advice. This forecast is for educational purposes only. Always do your own research and manage risk accordingly.