Technical analysis by Algo_Trading_Mql5 about Symbol PAXG: Sell recommendation (8/14/2025)

Algo_Trading_Mql5
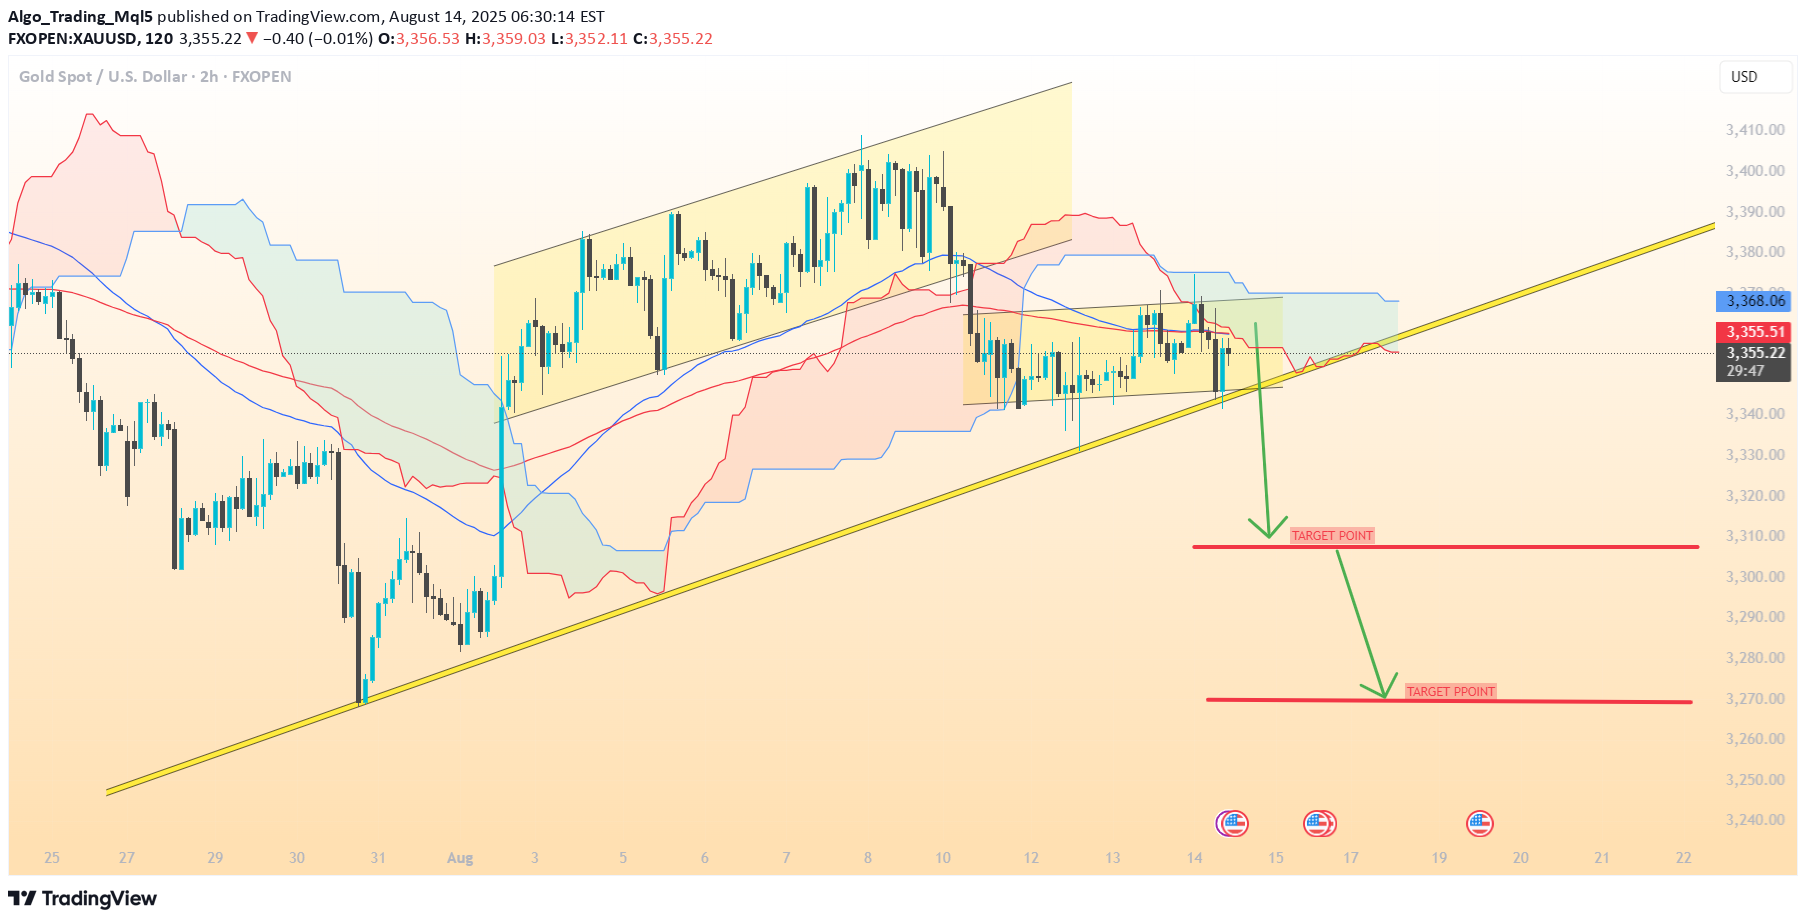
1. Price Action & Trendline Price is currently hovering just above your yellow upward trendline. A clean break below could trigger the bearish move my projecting toward the two target zones. 2. Ichimoku Cloud Price is inside the cloud, leaning toward the bearish side. The future cloud is slightly bearish (flat to downward Kumo). Tenkan-sen is below the Kijun-sen — short-term bearish signal. 3. Moving Averages The 50 EMA is crossing above the price, acting as resistance. The 200 EMA is also above the current price — longer-term bearish pressure. 4. Bearish Flag Structure The yellow channel you drew looks like a completed bearish flag. Measured move from the flagpole suggests the drop to around 3,310 first, then possibly 3,274. 5. Support & Volume First key support: 3,310 (matches your first target). If broken, strong next support is around 3,273–3,270. Volume on down candles appears higher than on up candles — confirms selling interest. 📉 Final multi-indicator targets: Target 1: 3,310 (short-term) Target 2: 3,273 (extended)trade active
