Technical analysis by ArmanShabanTrading about Symbol PAXG on 8/13/2025

ArmanShabanTrading
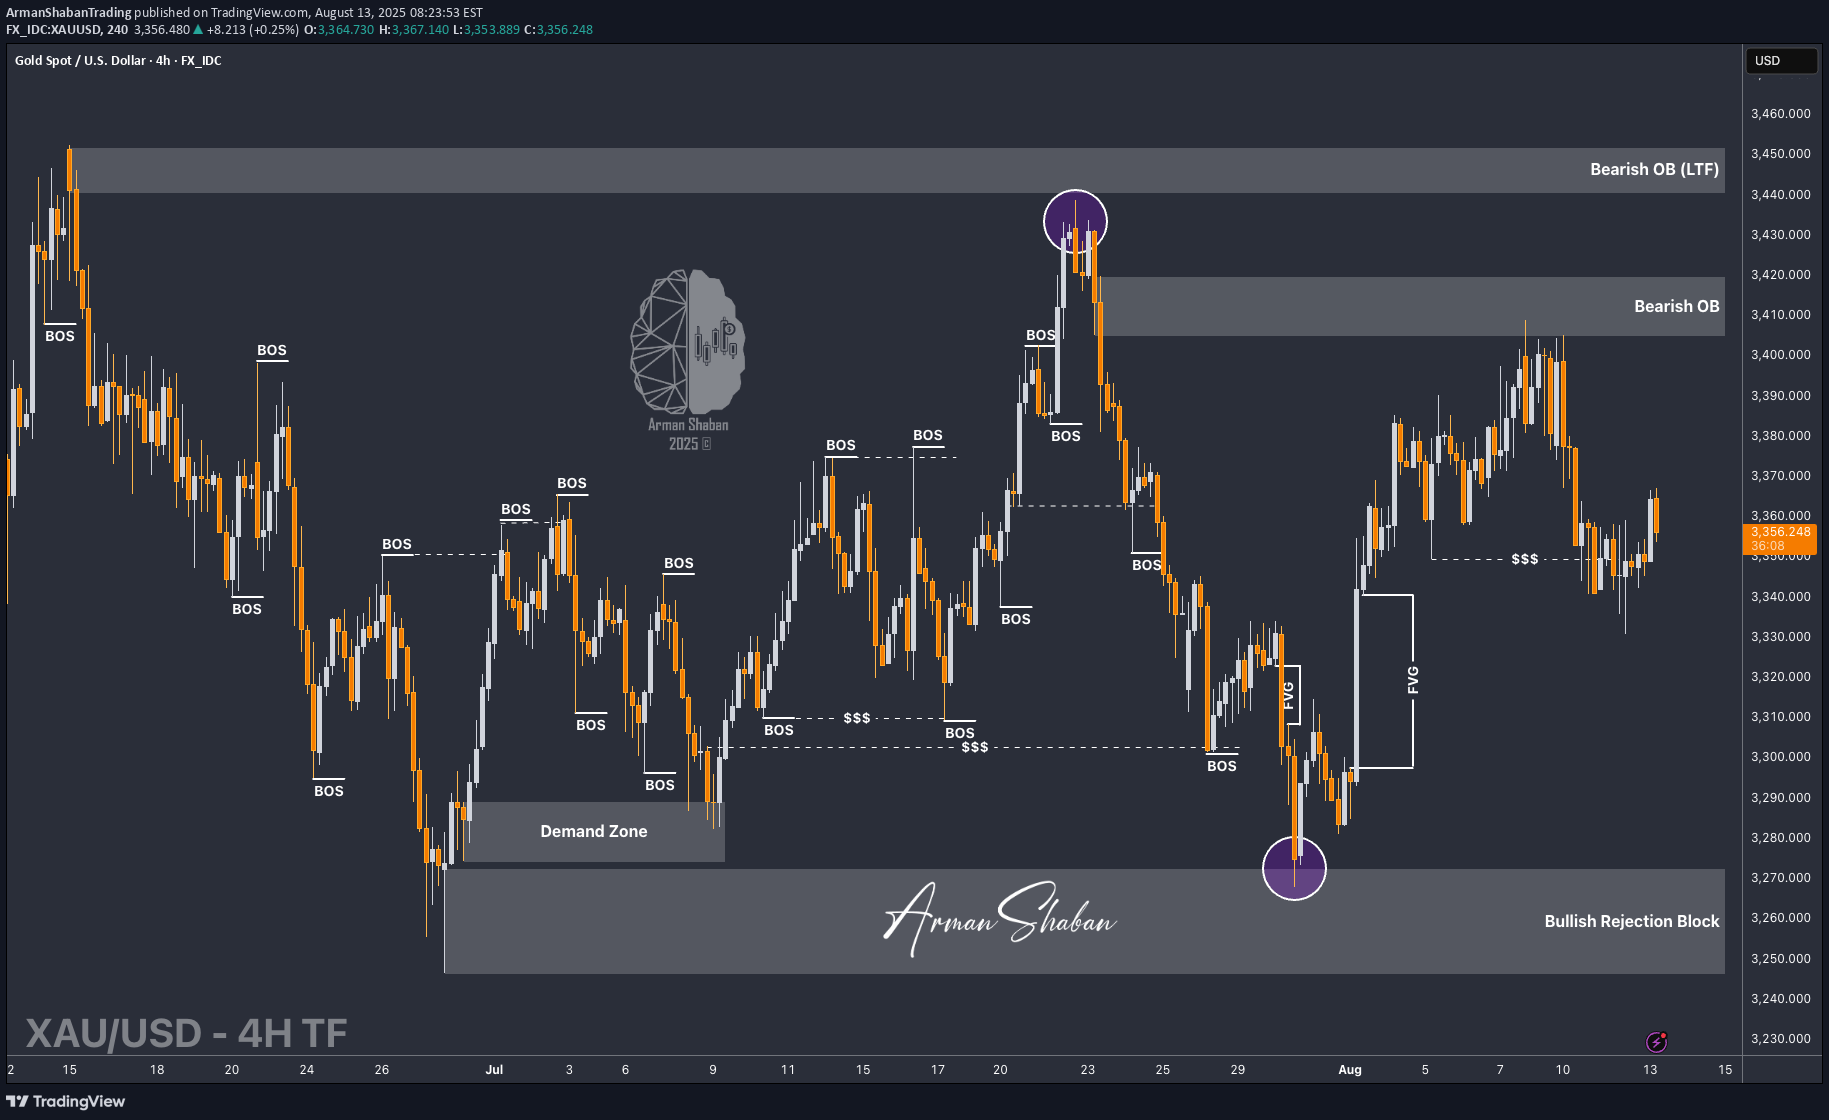
By analyzing the #Gold chart on the 4-hour timeframe, we can see that after correcting down to the $3331 demand zone, price faced strong buying pressure and is now trading around $3357. If gold manages to hold below $3367, we could expect a stronger drop, with downside targets at $3342, $3331, and $3323. This scenario will only fail if price holds above $3350, pushes past $3367, and closes above it — in that case, gold may rally back toward levels above $3390. This analysis will be updated soon — don’t forget to show some support, friends! Please support me with your likes and comments to motivate me to share more analysis with you and share your opinion about the possible trend of this chart with me ! Best Regards , Arman ShabanBy analyzing the gold chart on the 4-hour timeframe, we can see that, as expected, the price once again dropped below $3331, even sweeping down to $3329 to collect more liquidity. Gold is now trading around $3337, and if it stabilizes below $3355, we can anticipate further downside movement. The next potential bearish targets are $3314, $3301, and $3297.
