Technical analysis by seydkamal123 about Symbol PUMP on 8/10/2025

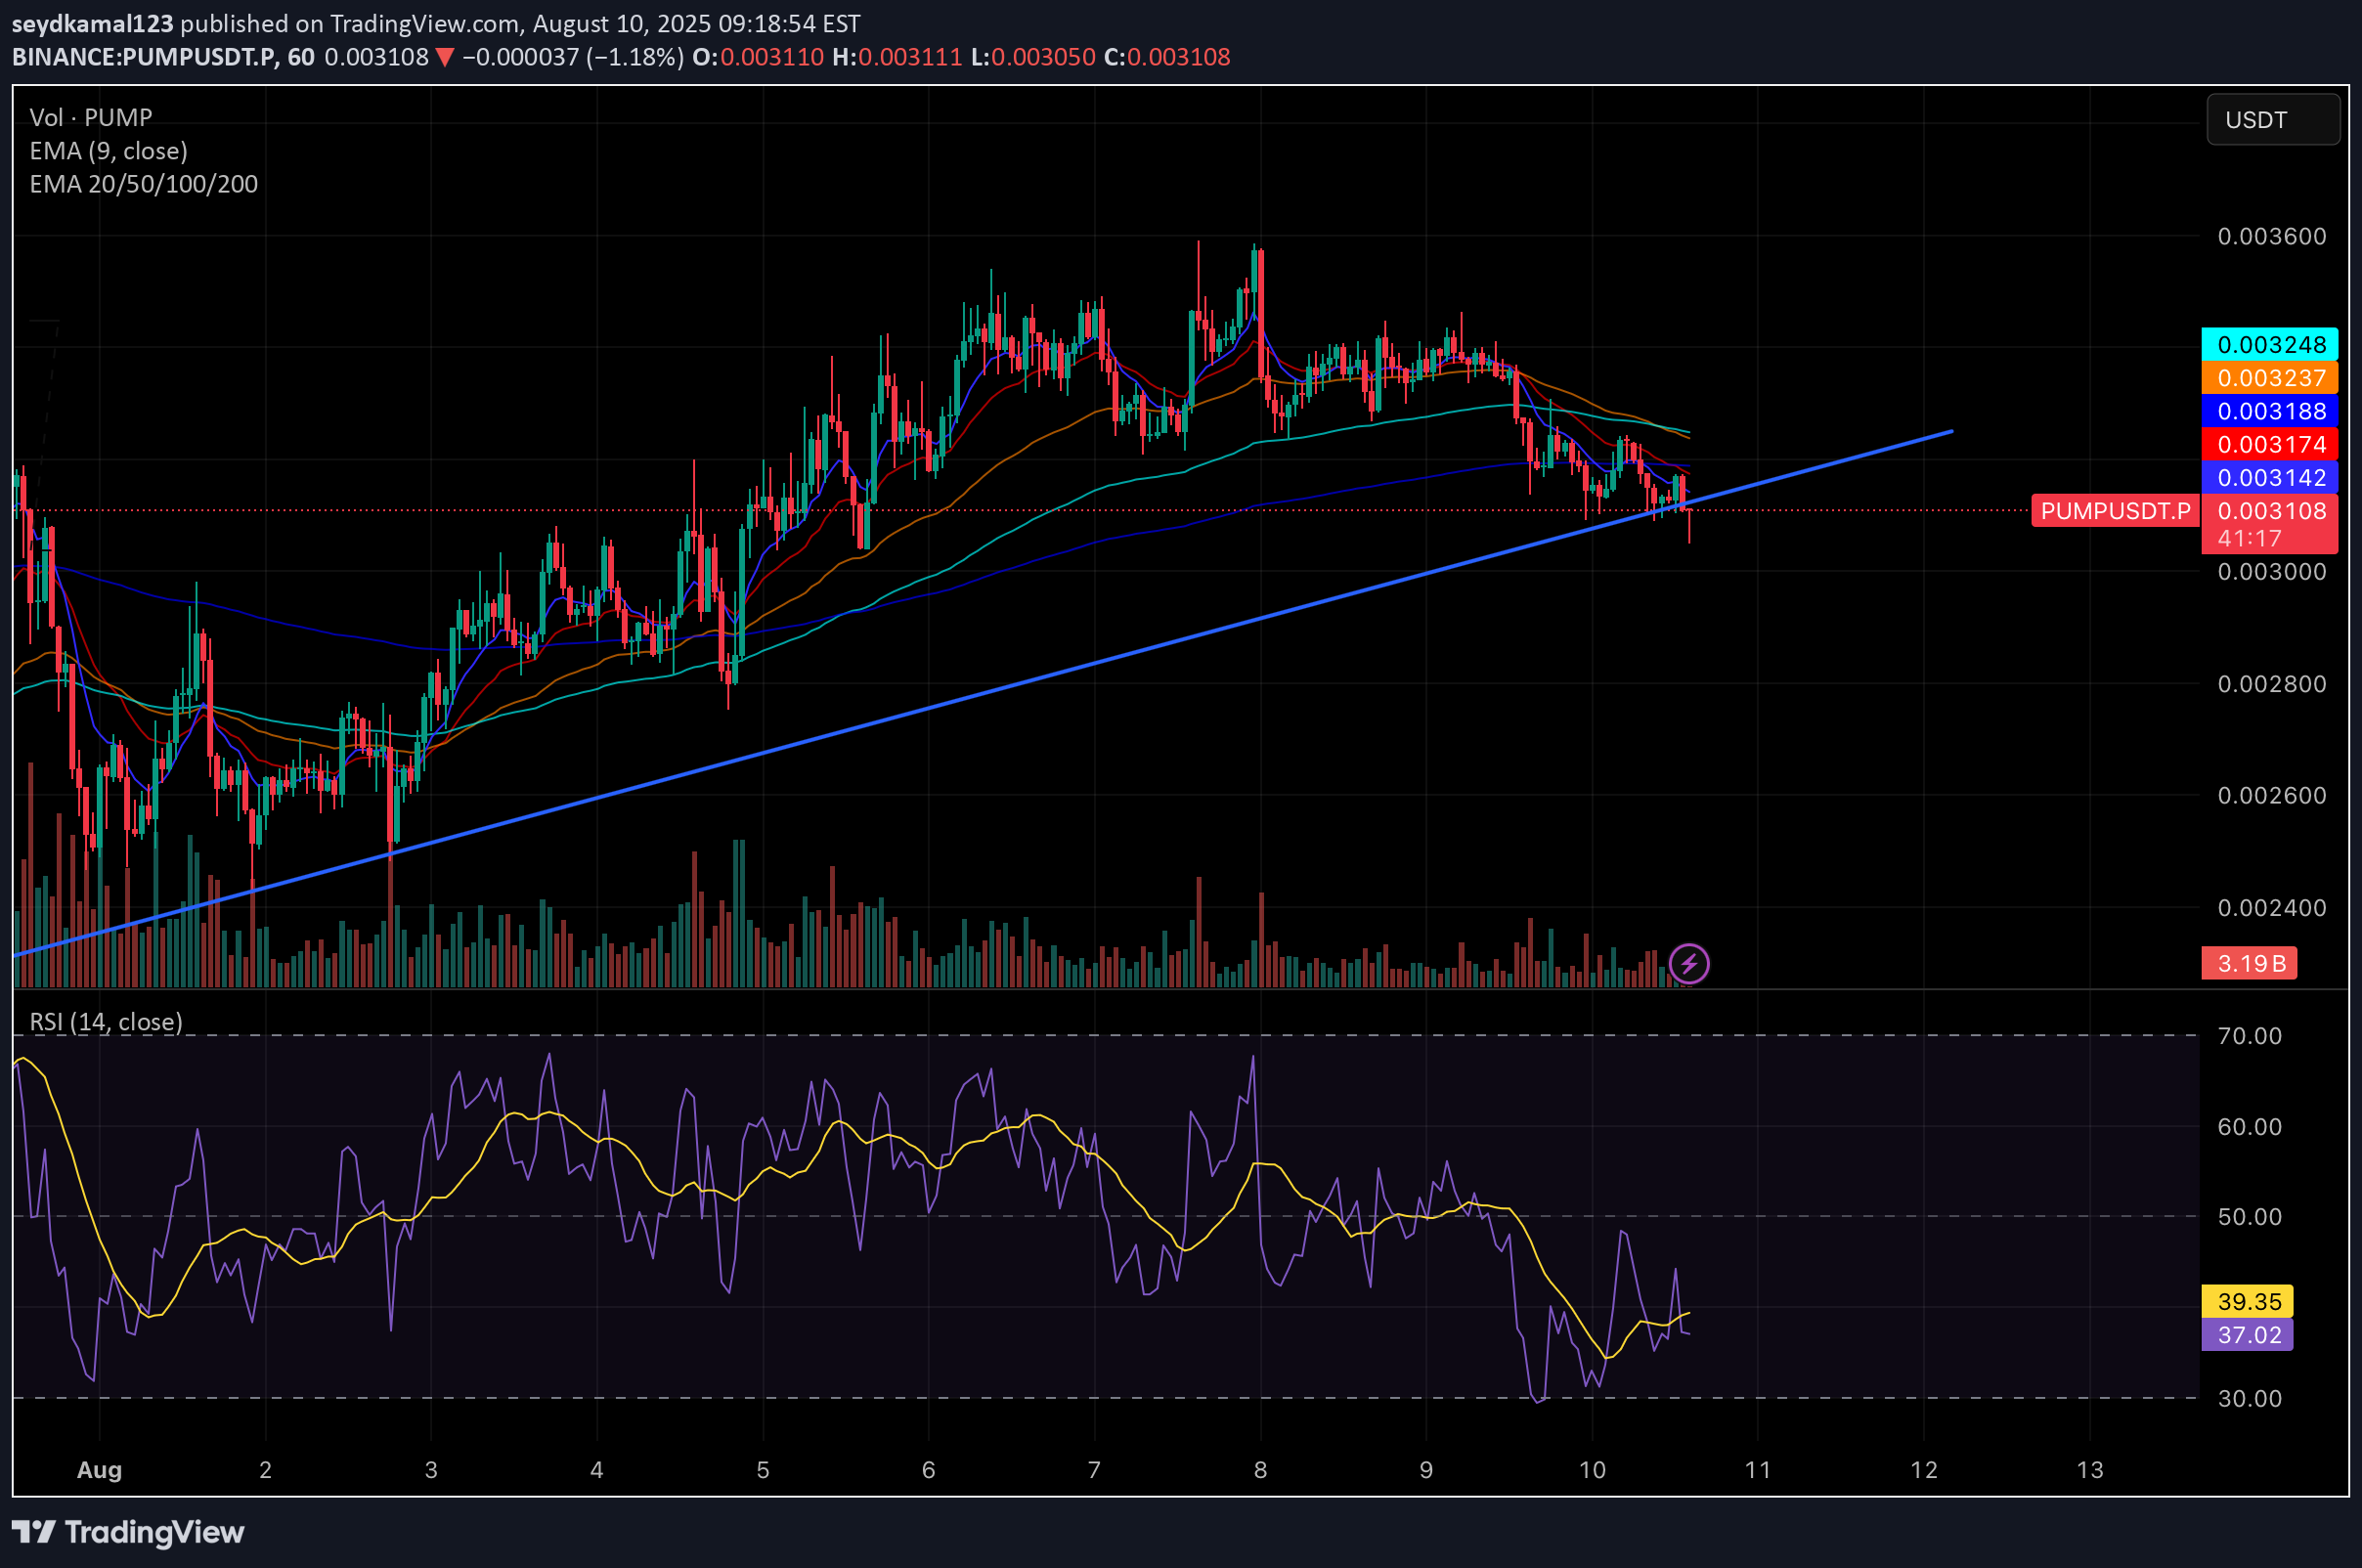
// version =5 indicator("EMA + RSI Signals (Light)", overlay=true) // ==== Inputs ==== fastLen = input.int(9, "Fast EMA length") slowLen = input.int(21, "Slow EMA length") rsiLen = input.int(14, "RSI length") rsiLongMin= input.int(45, "Min RSI for Long") rsiShortMax= input.int(55, "Max RSI for Sell") // ==== Calculations ==== emaFast = ta.ema(close, fastLen) emaSlow = ta.ema(close, slowLen) rsiVal = ta.rsi(close, rsiLen) // ==== Signals ==== longSignal = ta.crossover(emaFast, emaSlow) and (rsiVal >= rsiLongMin) sellSignal = ta.crossunder(emaFast, emaSlow) and (rsiVal <= rsiShortMax) // ==== Plot EMAs ==== plot(emaFast, color=color.green, linewidth=2) plot(emaSlow, color=color.red, linewidth=2) // ==== Plot Signals ==== plotshape(longSignal, title="Long", location=location.belowbar, color=color.green, style=shape.labelup, text="LONG") plotshape(sellSignal, title="Sell", location=location.abovebar, color=color.red, style=shape.labeldown, text="SELL") // ==== Alerts ==== alertcondition(longSignal, title="Long Alert", message="LONG signal triggered") alertcondition(sellSignal, title="Sell Alert", message="SELL signal triggered")
