seydkamal123
@t_seydkamal123
What symbols does the trader recommend buying?
Purchase History
پیام های تریدر
Filter
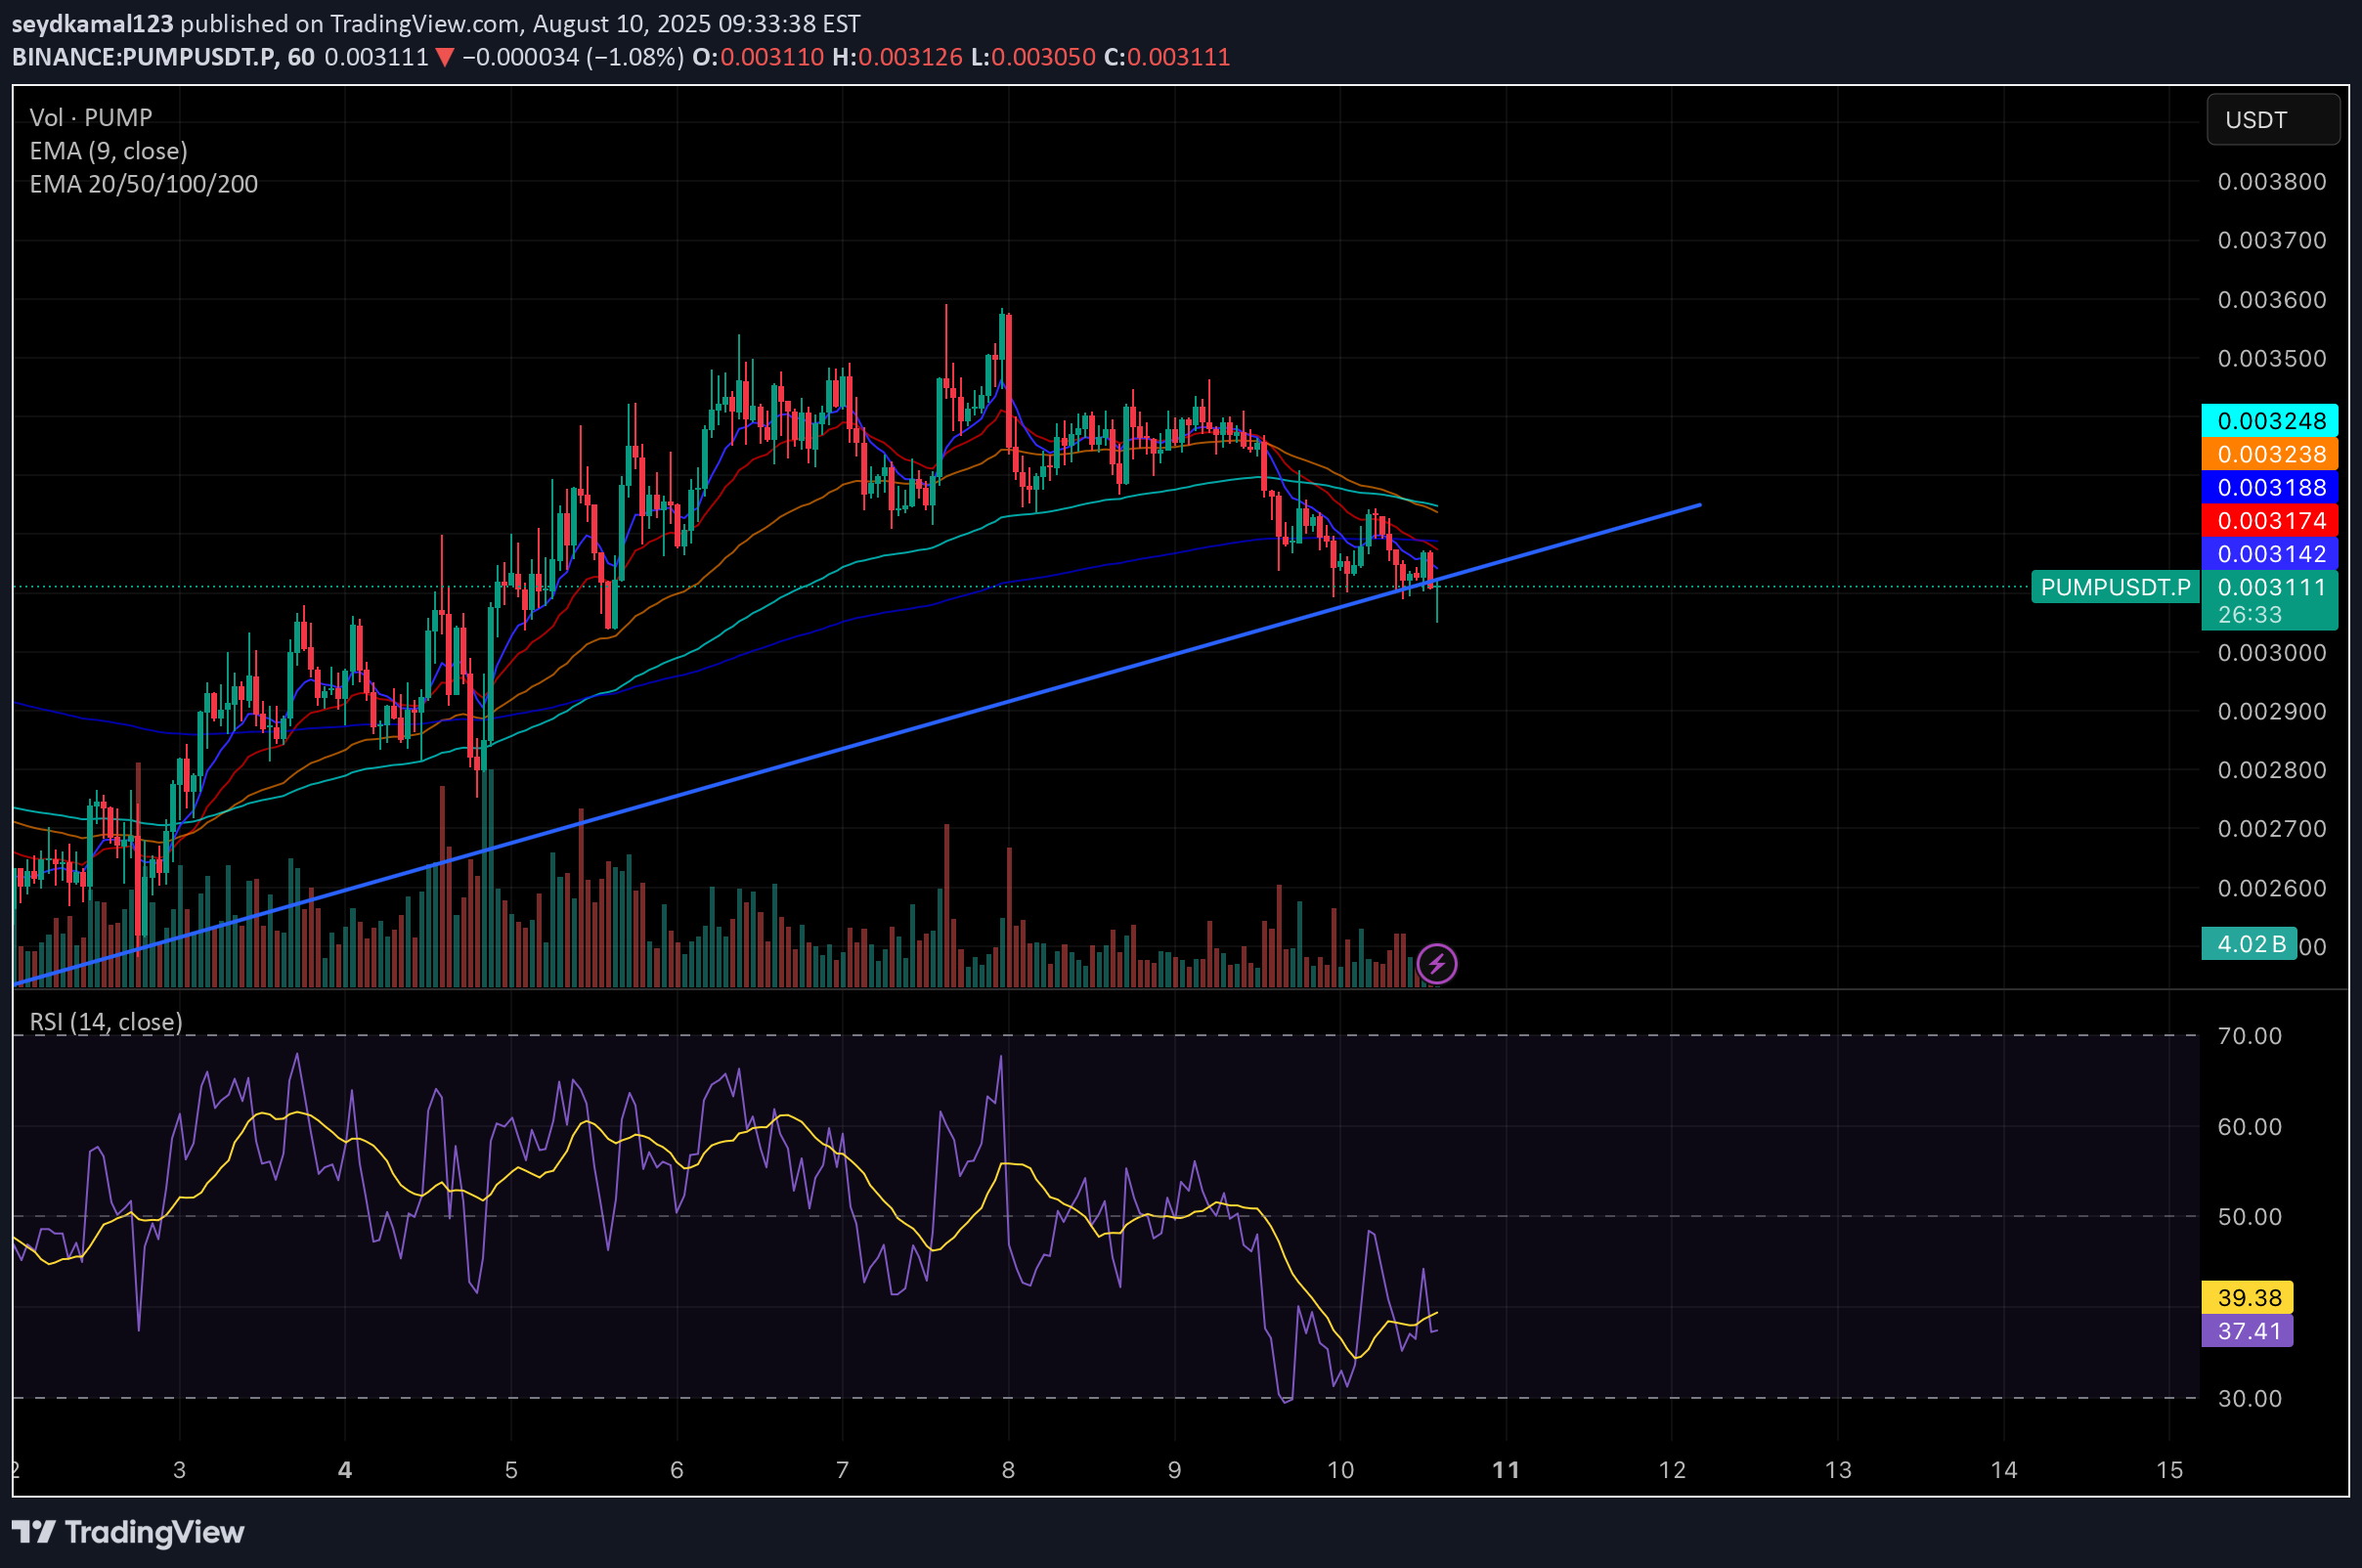
// version =5 strategy("EMA crossover + RSI filter (Long/Sell) — Simple", overlay=true, default_qty_type=strategy.percent_of_equity, default_qty_value=10, initial_capital=10000) // ======= INPUTS (قابل تغییر) ======= fastLen = input.int(9, "Fast EMA length") slowLen = input.int(21, "Slow EMA length") rsiLen = input.int(14, "RSI length") rsiLongMin= input.int(45, "Min RSI for Long (filter)") rsiShortMax= input.int(55, "Max RSI for Short (filter)") useShorts = input.bool(false,"Allow Shorts? (if OFF: only close longs on sell)") atrLen = input.int(14, "ATR length (for SL)") atrMult = input.float(2.0,"ATR multiplier (for SL)") takeProfitR = input.float(1.5, "Take Profit (x ATR)", step=0.1) tradeSizePct = input.float(10, "Position size (% equity)", step=0.1) // ======= INDICATORS ======= emaFast = ta.ema(close, fastLen) emaSlow = ta.ema(close, slowLen) rsiVal = ta.rsi(close, rsiLen) atrVal = ta.atr(atrLen) // plot EMAs plot(emaFast, title="EMA Fast", linewidth=2) plot(emaSlow, title="EMA Slow", linewidth=2) // ======= SIGNALS ======= // Long signal: EMA fast cross above slow AND RSI above filter longSignal = ta.crossover(emaFast, emaSlow) and (rsiVal >= rsiLongMin) // Sell/Short signal: EMA fast cross below slow AND RSI below filter shortSignal = ta.crossunder(emaFast, emaSlow) and (rsiVal <= rsiShortMax) // ======= ENTRY / EXIT ======= // position sizing strategy.risk.allow_entry_in(strategy.direction.long) strategy.risk.allow_entry_in(strategy.direction.short) strategy.order_info(true) strategy.exit_on_close(true) strategy.set_max_bars_back(math.max(fastLen, slowLen, rsiLen, atrLen)) // compute SL and TP price levels (absolute) longStopPrice = close - atrVal * atrMult longTPPrice = close + atrVal * takeProfitR shortStopPrice = close + atrVal * atrMult shortTPPrice = close - atrVal * takeProfitR // manage position sizing strategy.risk.allow_entry_in(strategy.direction.long) strategy.risk.allow_entry_in(strategy.direction.short) strategy.order_info(true) strategy.entry("Long", strategy.long, qty_percent=tradeSizePct, when=longSignal) if useShorts strategy.entry("Short", strategy.short, qty_percent=tradeSizePct, when=shortSignal) else // اگر شورت فعال نیست، سیگنال شورت فقط باعث بستن لانگ میشود if shortSignal strategy.close("Long", comment="CloseLong_on_ShortSignal") // exits for entries (only if the position exists) // apply TP/SL with strategy.exit (referencing entry id) strategy.exit("Long_exit", from_entry="Long", stop=longStopPrice, limit=longTPPrice) if useShorts strategy.exit("Short_exit", from_entry="Short", stop=shortStopPrice, limit=shortTPPrice) // ======= VISUAL ======= plotshape(longSignal, title="Long Signal", location=location.belowbar, color=color.new(color.green,0), style=shape.labelup, text="LONG") plotshape(shortSignal, title="Sell/Short Signal", location=location.abovebar, color=color.new(color.red,0), style=shape.labeldown, text="SELL") // RSI panel rsiPlot = plot(rsiVal, title="RSI", display=display.none) // hide in price pane h1 = hline(50, "RSI 50", color=color.gray, linestyle=hline.style_dotted) // ======= ALERTS ======= alertcondition(longSignal, title="Long Signal", message="EMA crossover + RSI => LONG") alertcondition(shortSignal, title="Sell Signal", message="EMA crossover + RSI => SELL/SHORT") // ======= INFO (print small label) ======= var table info = table.new(position.bottom_right, 1, 1) if barstate.islast table.cell(info, 0, 0, text="EMA: " + str.tostring(fastLen) + "/" + str.tostring(slowLen) + " RSI:" + str.tostring(rsiLen) + " ATRx:" + str.tostring(atrMult), text_color=color.white, bgcolor=color.new(color.blue,60))
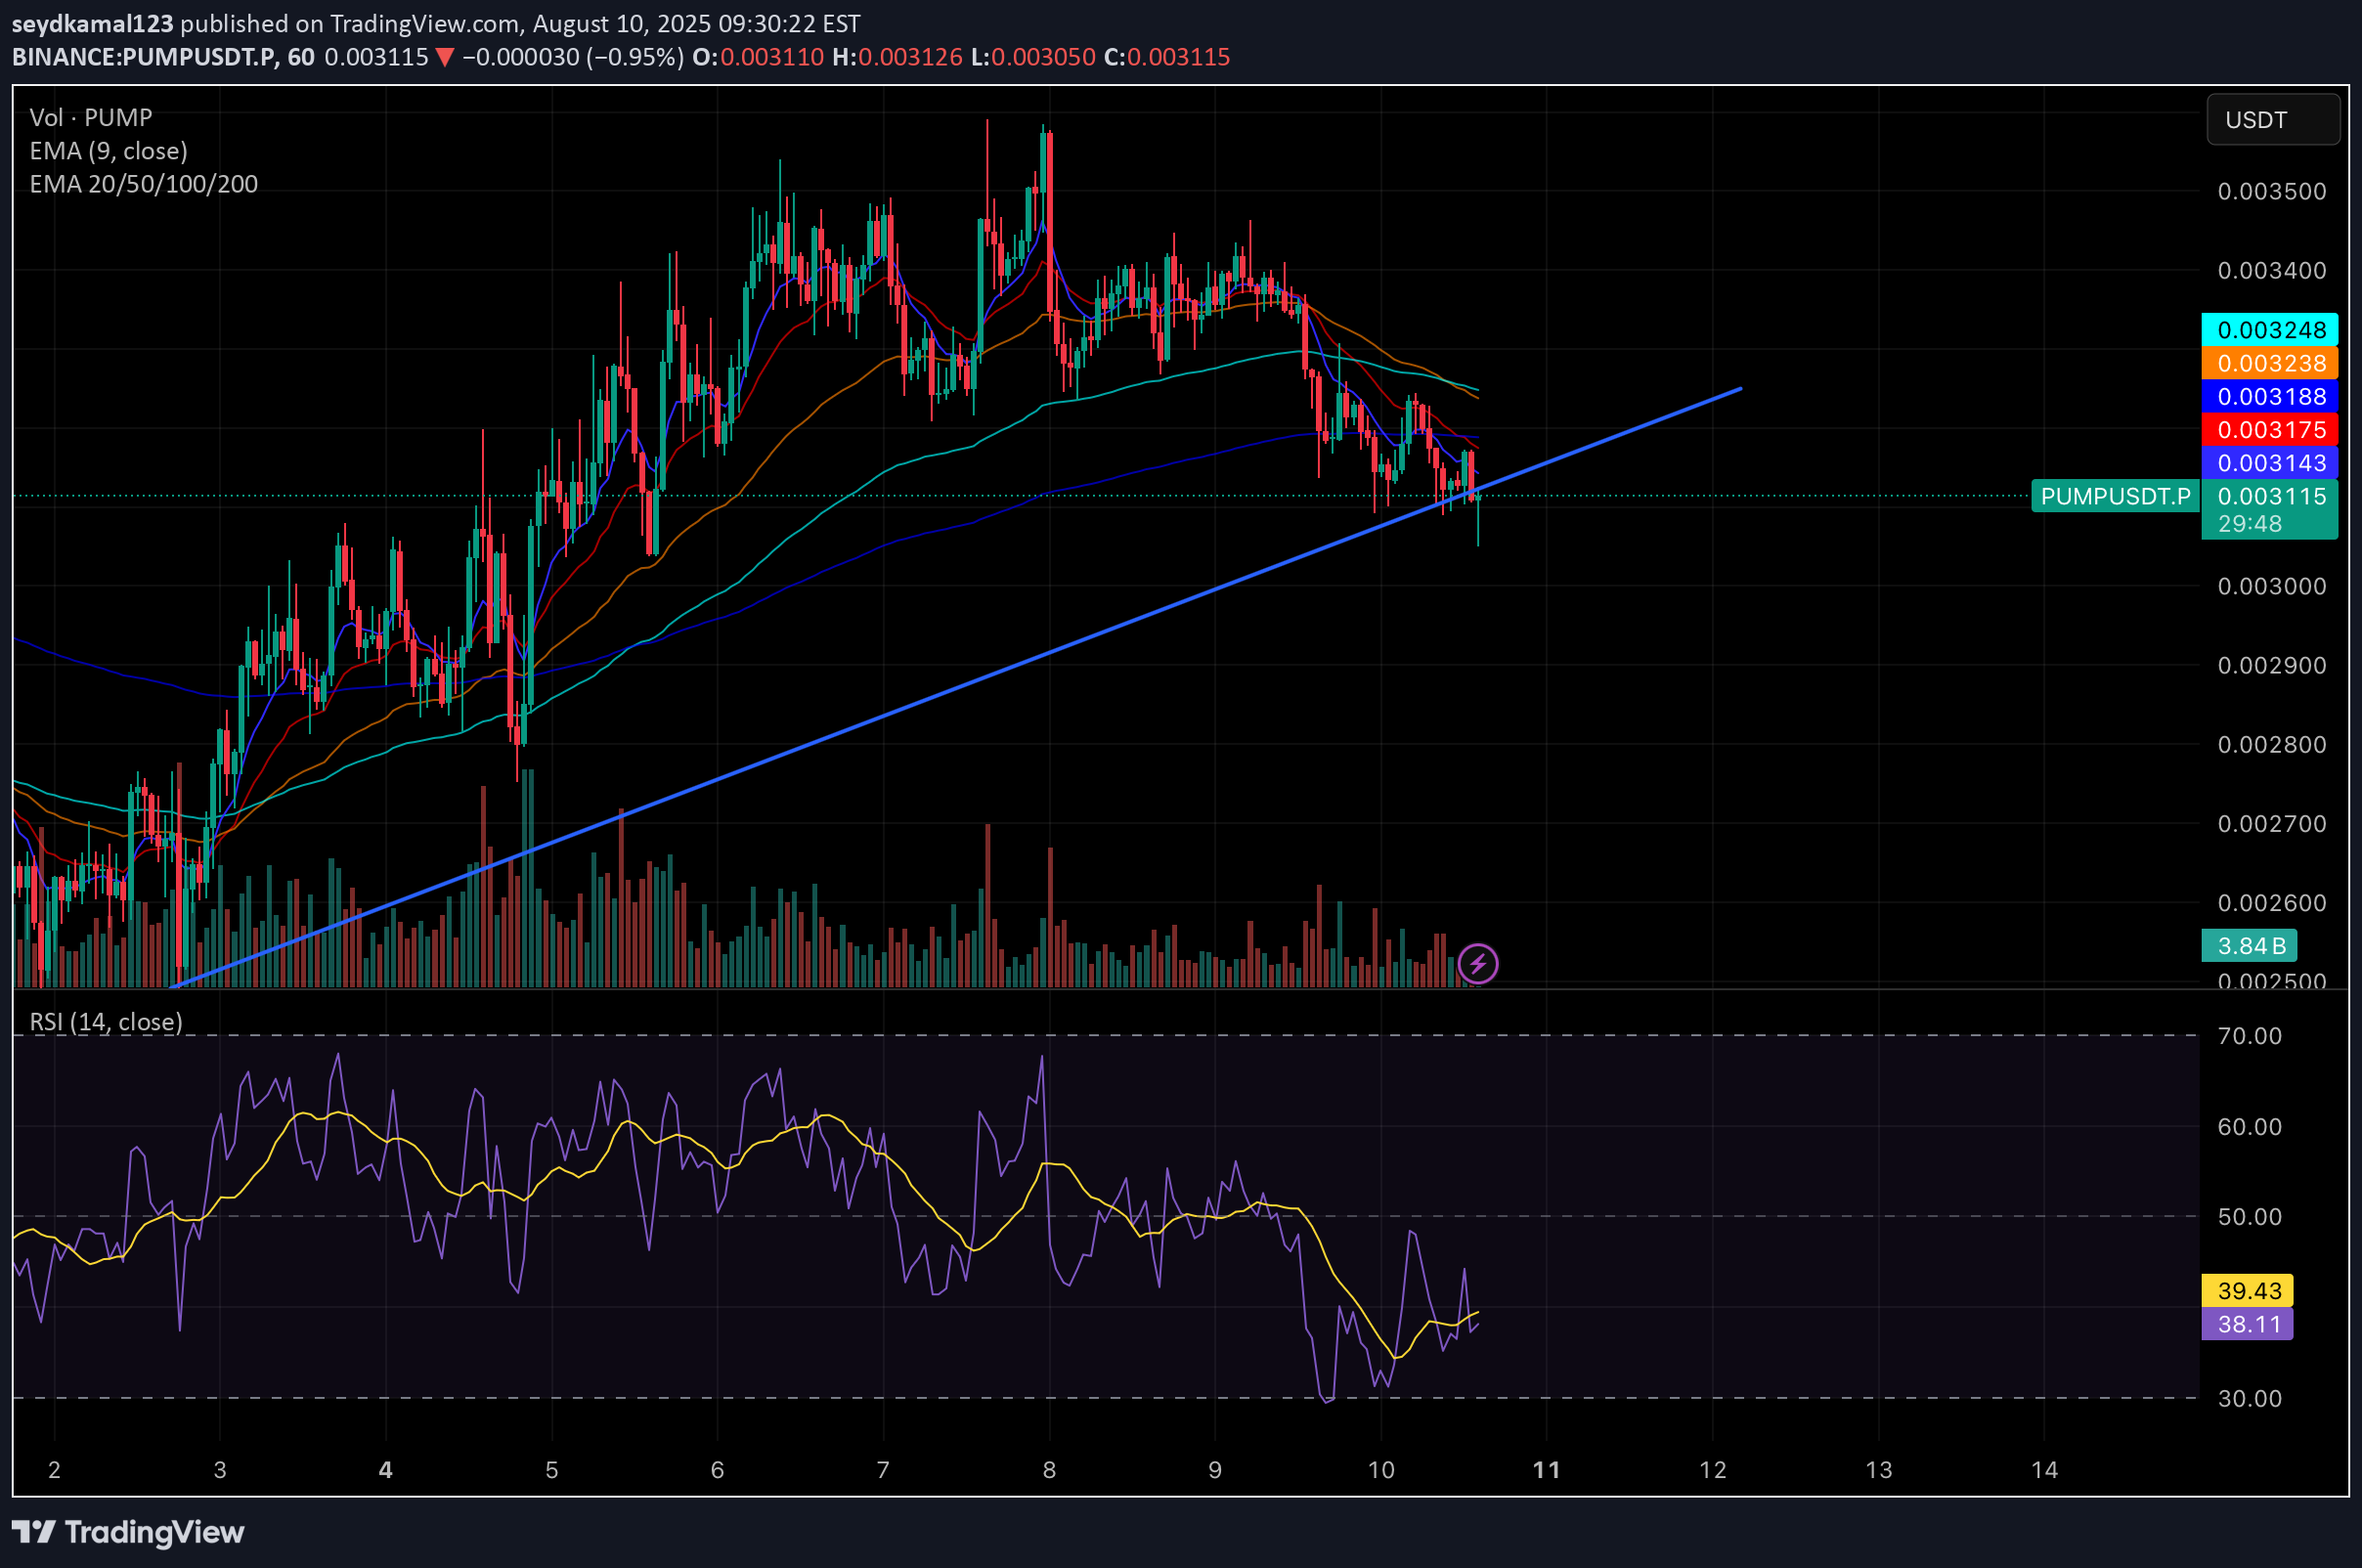
// version =5 indicator("EMA + RSI Signals (Light)", overlay=true) // ==== Inputs ==== fastLen = input.int(9, "Fast EMA length") slowLen = input.int(21, "Slow EMA length") rsiLen = input.int(14, "RSI length") rsiLongMin= input.int(45, "Min RSI for Long") rsiShortMax= input.int(55, "Max RSI for Sell") // ==== Calculations ==== emaFast = ta.ema(close, fastLen) emaSlow = ta.ema(close, slowLen) rsiVal = ta.rsi(close, rsiLen) // ==== Signals ==== longSignal = ta.crossover(emaFast, emaSlow) and (rsiVal >= rsiLongMin) sellSignal = ta.crossunder(emaFast, emaSlow) and (rsiVal <= rsiShortMax) // ==== Plot EMAs ==== plot(emaFast, color=color.green, linewidth=2) plot(emaSlow, color=color.red, linewidth=2) // ==== Plot Signals ==== plotshape(longSignal, title="Long", location=location.belowbar, color=color.green, style=shape.labelup, text="LONG") plotshape(sellSignal, title="Sell", location=location.abovebar, color=color.red, style=shape.labeldown, text="SELL") // ==== Alerts ==== alertcondition(longSignal, title="Long Alert", message="LONG signal triggered") alertcondition(sellSignal, title="Sell Alert", message="SELL signal triggered")
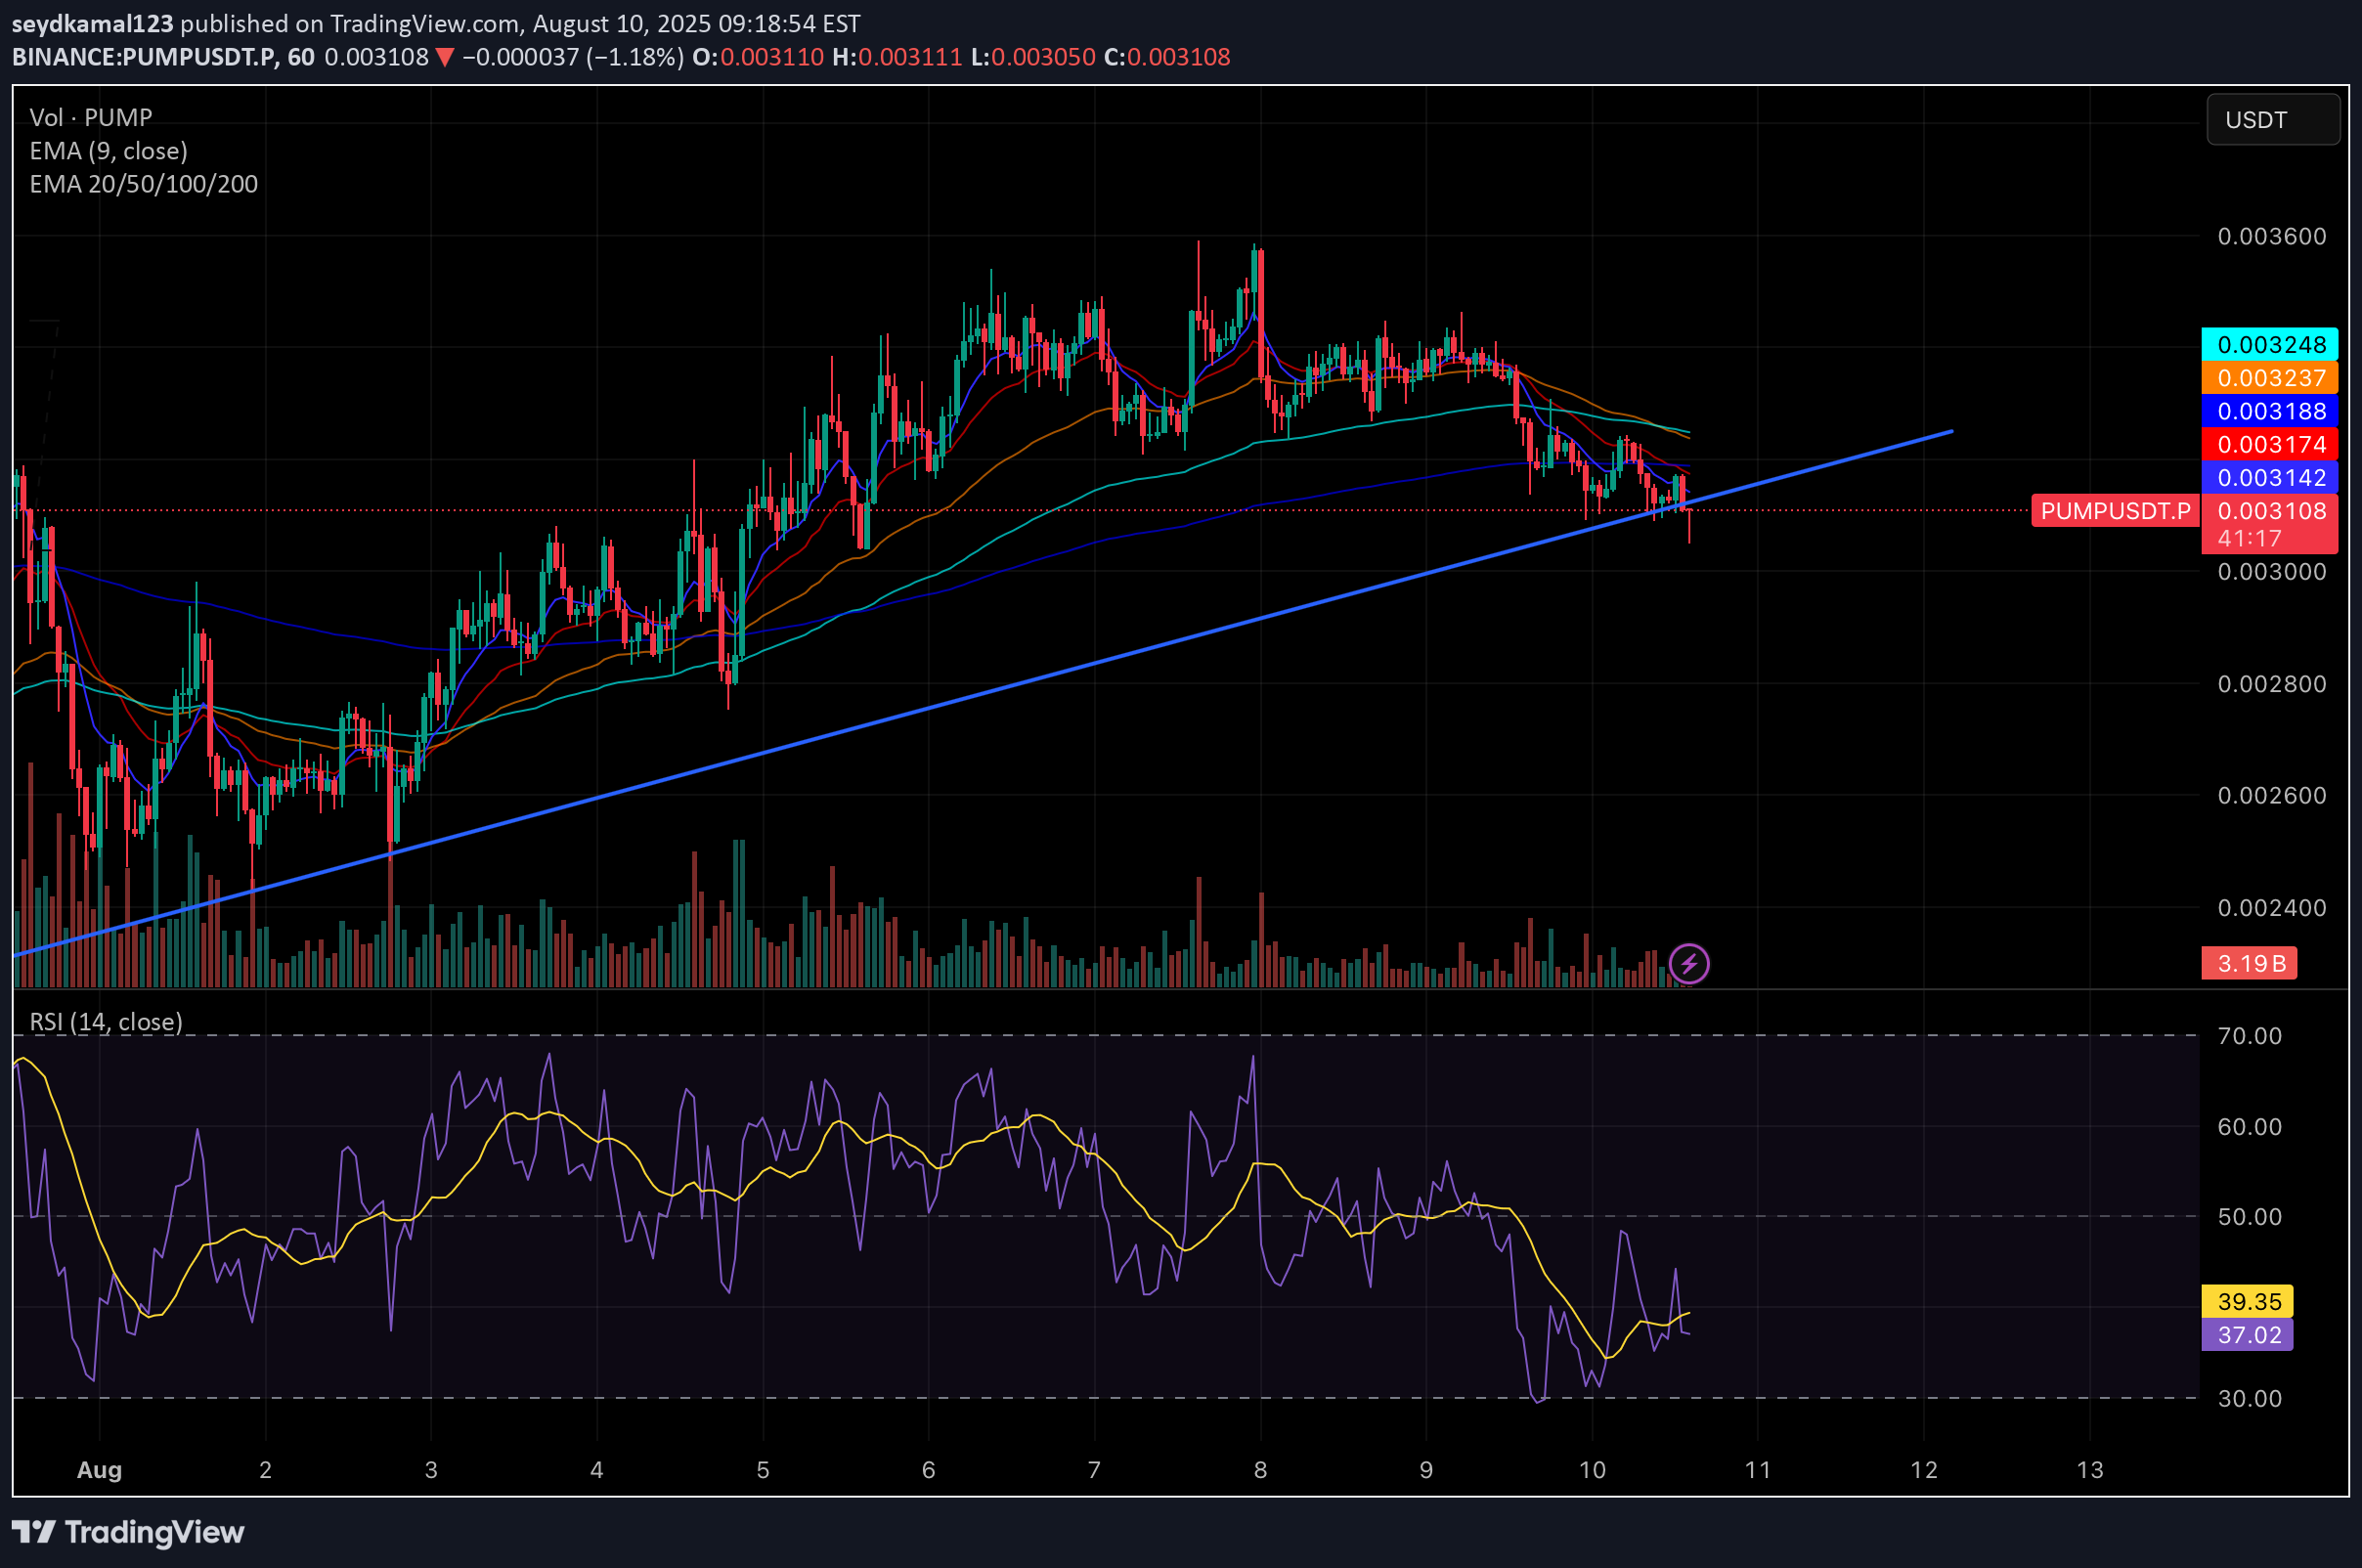
// version =5 indicator("EMA + RSI Signals (Light)", overlay=true) // ==== Inputs ==== fastLen = input.int(9, "Fast EMA length") slowLen = input.int(21, "Slow EMA length") rsiLen = input.int(14, "RSI length") rsiLongMin= input.int(45, "Min RSI for Long") rsiShortMax= input.int(55, "Max RSI for Sell") // ==== Calculations ==== emaFast = ta.ema(close, fastLen) emaSlow = ta.ema(close, slowLen) rsiVal = ta.rsi(close, rsiLen) // ==== Signals ==== longSignal = ta.crossover(emaFast, emaSlow) and (rsiVal >= rsiLongMin) sellSignal = ta.crossunder(emaFast, emaSlow) and (rsiVal <= rsiShortMax) // ==== Plot EMAs ==== plot(emaFast, color=color.green, linewidth=2) plot(emaSlow, color=color.red, linewidth=2) // ==== Plot Signals ==== plotshape(longSignal, title="Long", location=location.belowbar, color=color.green, style=shape.labelup, text="LONG") plotshape(sellSignal, title="Sell", location=location.abovebar, color=color.red, style=shape.labeldown, text="SELL") // ==== Alerts ==== alertcondition(longSignal, title="Long Alert", message="LONG signal triggered") alertcondition(sellSignal, title="Sell Alert", message="SELL signal triggered")
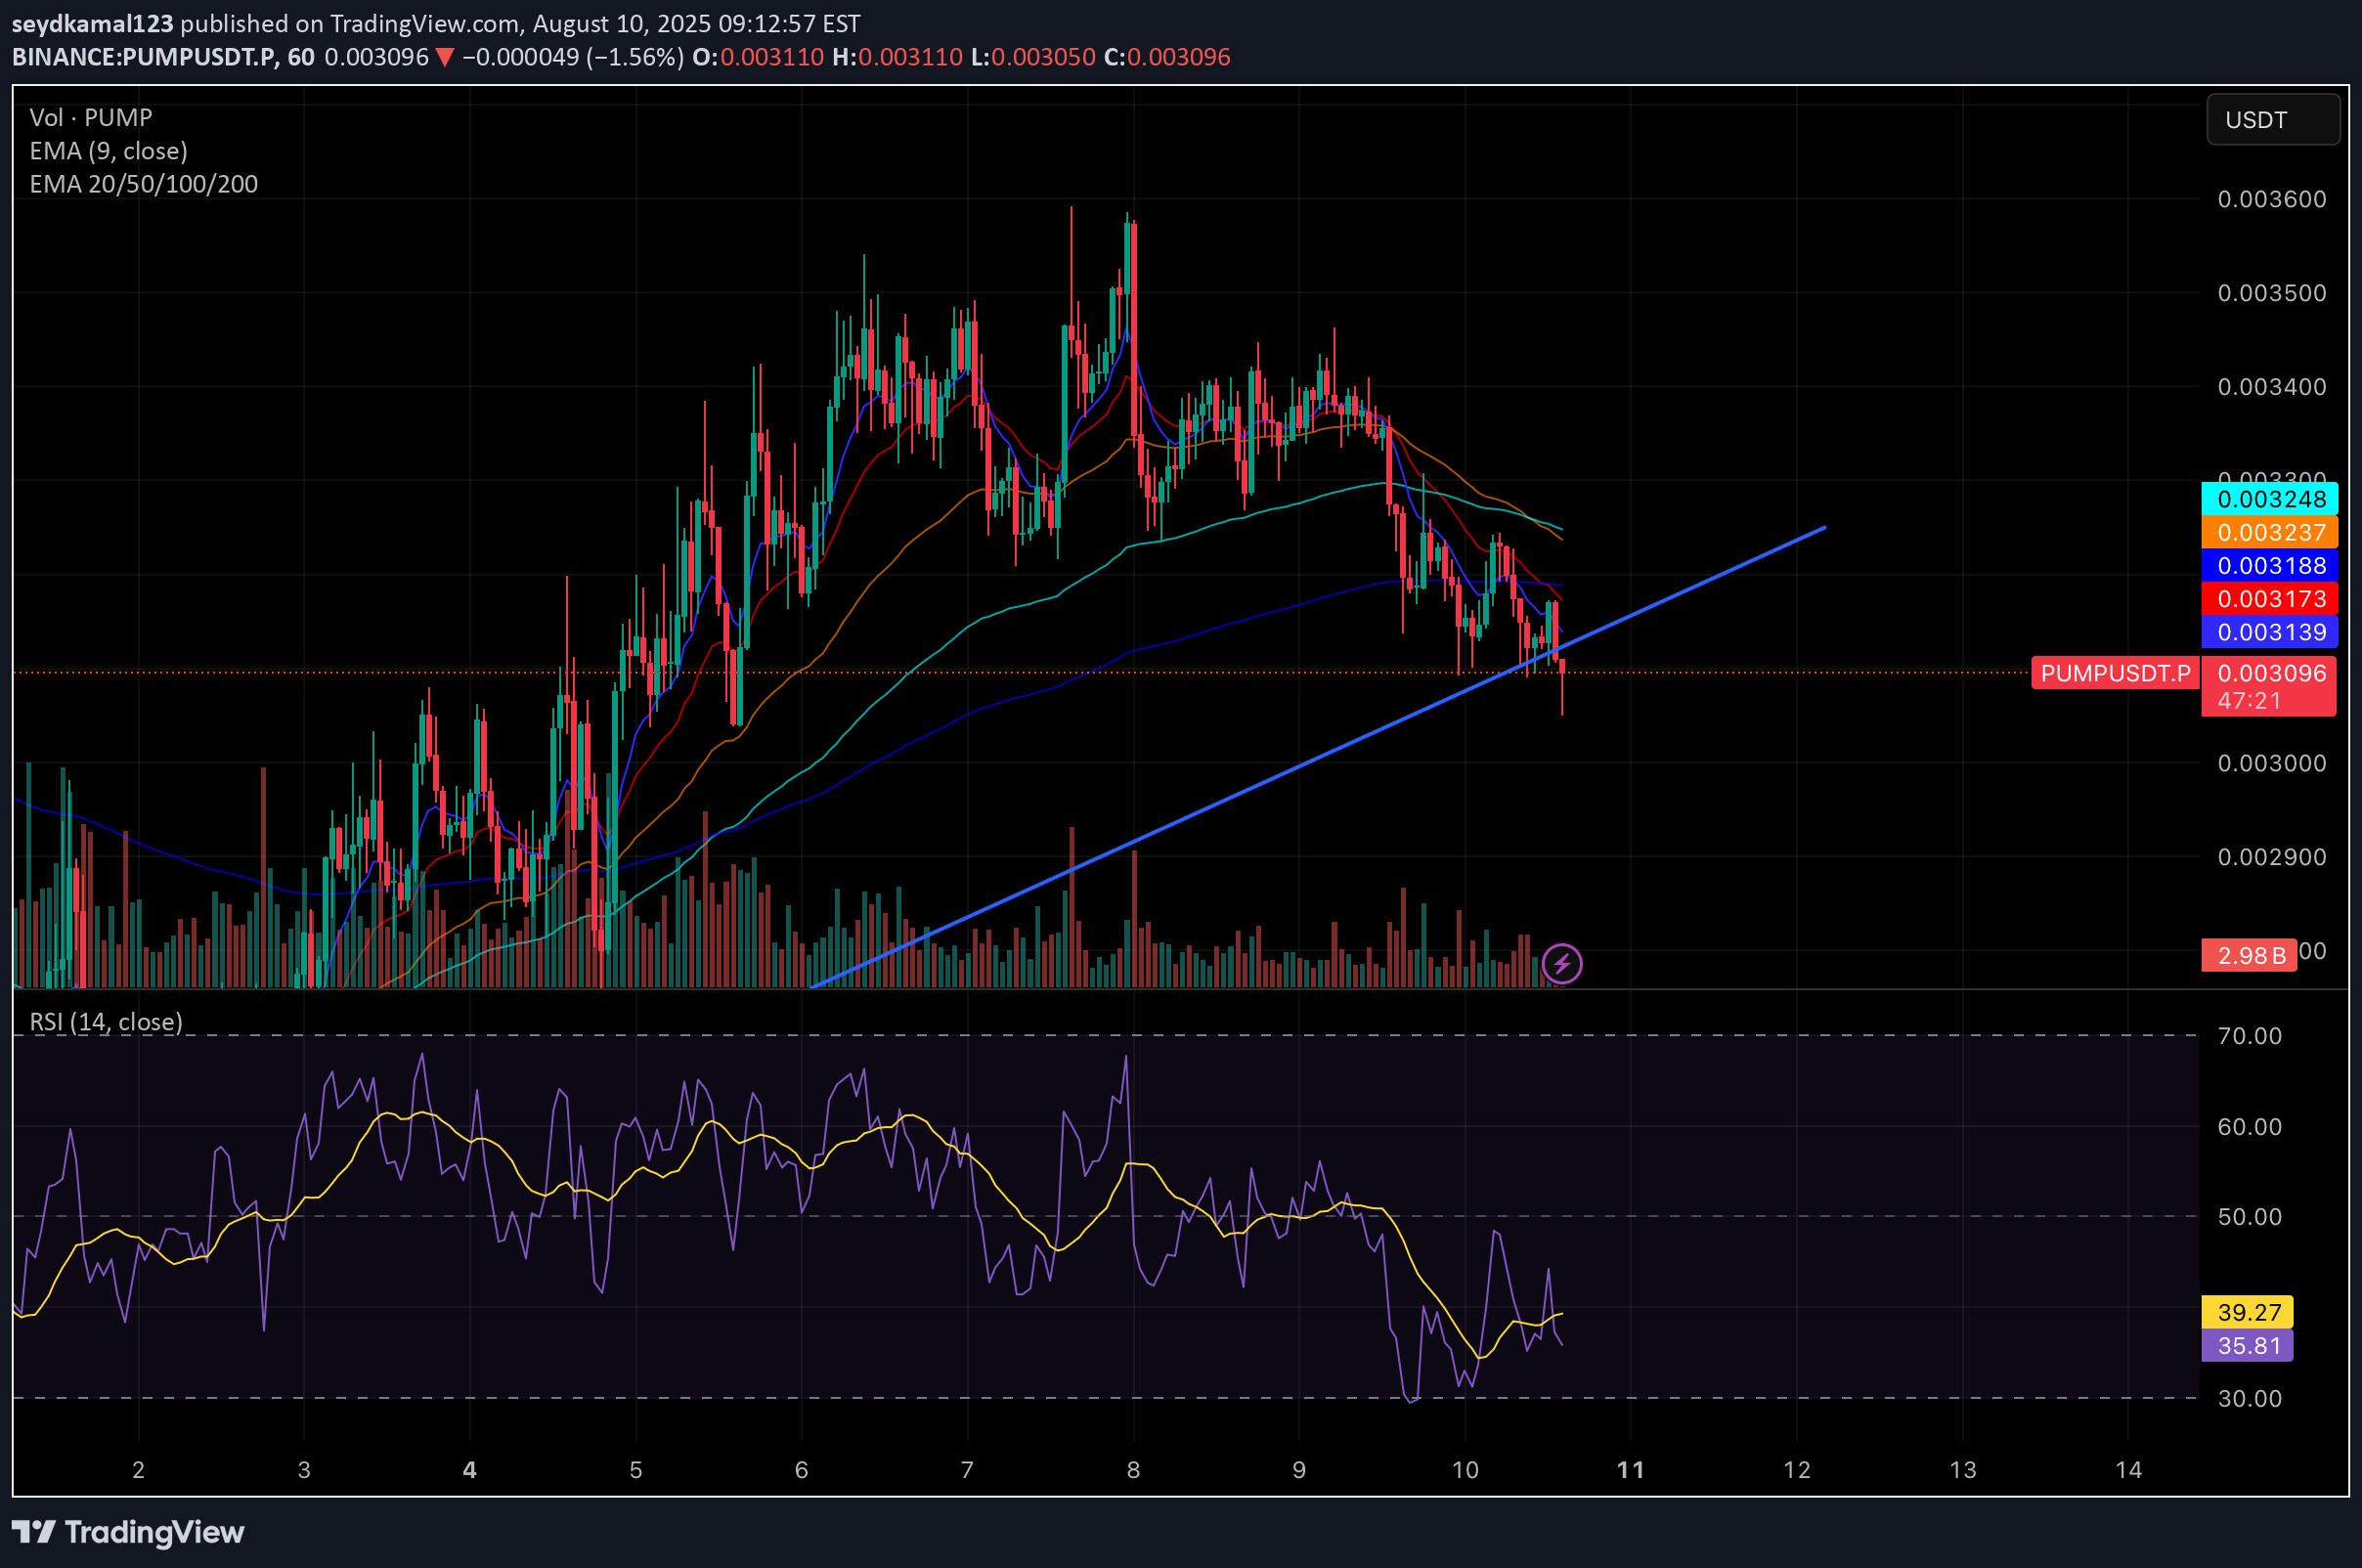
// version =5 strategy("EMA crossover + RSI filter (Long/Sell) — Simple", overlay=true, default_qty_type=strategy.percent_of_equity, default_qty_value=10, initial_capital=10000) // ======= INPUTS (قابل تغییر) ======= fastLen = input.int(9, "Fast EMA length") slowLen = input.int(21, "Slow EMA length") rsiLen = input.int(14, "RSI length") rsiLongMin= input.int(45, "Min RSI for Long (filter)") rsiShortMax= input.int(55, "Max RSI for Short (filter)") useShorts = input.bool(false,"Allow Shorts? (if OFF: only close longs on sell)") atrLen = input.int(14, "ATR length (for SL)") atrMult = input.float(2.0,"ATR multiplier (for SL)") takeProfitR = input.float(1.5, "Take Profit (x ATR)", step=0.1) tradeSizePct = input.float(10, "Position size (% equity)", step=0.1) // ======= INDICATORS ======= emaFast = ta.ema(close, fastLen) emaSlow = ta.ema(close, slowLen) rsiVal = ta.rsi(close, rsiLen) atrVal = ta.atr(atrLen) // plot EMAs plot(emaFast, title="EMA Fast", linewidth=2) plot(emaSlow, title="EMA Slow", linewidth=2) // ======= SIGNALS ======= // Long signal: EMA fast cross above slow AND RSI above filter longSignal = ta.crossover(emaFast, emaSlow) and (rsiVal >= rsiLongMin) // Sell/Short signal: EMA fast cross below slow AND RSI below filter shortSignal = ta.crossunder(emaFast, emaSlow) and (rsiVal <= rsiShortMax) // ======= ENTRY / EXIT ======= // position sizing strategy.risk.allow_entry_in(strategy.direction.long) strategy.risk.allow_entry_in(strategy.direction.short) strategy.order_info(true) strategy.exit_on_close(true) strategy.set_max_bars_back(math.max(fastLen, slowLen, rsiLen, atrLen)) // compute SL and TP price levels (absolute) longStopPrice = close - atrVal * atrMult longTPPrice = close + atrVal * takeProfitR shortStopPrice = close + atrVal * atrMult shortTPPrice = close - atrVal * takeProfitR // manage position sizing strategy.risk.allow_entry_in(strategy.direction.long) strategy.risk.allow_entry_in(strategy.direction.short) strategy.order_info(true) strategy.entry("Long", strategy.long, qty_percent=tradeSizePct, when=longSignal) if useShorts strategy.entry("Short", strategy.short, qty_percent=tradeSizePct, when=shortSignal) else // اگر شورت فعال نیست، سیگنال شورت فقط باعث بستن لانگ میشود if shortSignal strategy.close("Long", comment="CloseLong_on_ShortSignal") // exits for entries (only if the position exists) // apply TP/SL with strategy.exit (referencing entry id) strategy.exit("Long_exit", from_entry="Long", stop=longStopPrice, limit=longTPPrice) if useShorts strategy.exit("Short_exit", from_entry="Short", stop=shortStopPrice, limit=shortTPPrice) // ======= VISUAL ======= plotshape(longSignal, title="Long Signal", location=location.belowbar, color=color.new(color.green,0), style=shape.labelup, text="LONG") plotshape(shortSignal, title="Sell/Short Signal", location=location.abovebar, color=color.new(color.red,0), style=shape.labeldown, text="SELL") // RSI panel rsiPlot = plot(rsiVal, title="RSI", display=display.none) // hide in price pane h1 = hline(50, "RSI 50", color=color.gray, linestyle=hline.style_dotted) // ======= ALERTS ======= alertcondition(longSignal, title="Long Signal", message="EMA crossover + RSI => LONG") alertcondition(shortSignal, title="Sell Signal", message="EMA crossover + RSI => SELL/SHORT") // ======= INFO (print small label) ======= var table info = table.new(position.bottom_right, 1, 1) if barstate.islast table.cell(info, 0, 0, text="EMA: " + str.tostring(fastLen) + "/" + str.tostring(slowLen) + " RSI:" + str.tostring(rsiLen) + " ATRx:" + str.tostring(atrMult), text_color=color.white, bgcolor=color.new(color.blue,60))
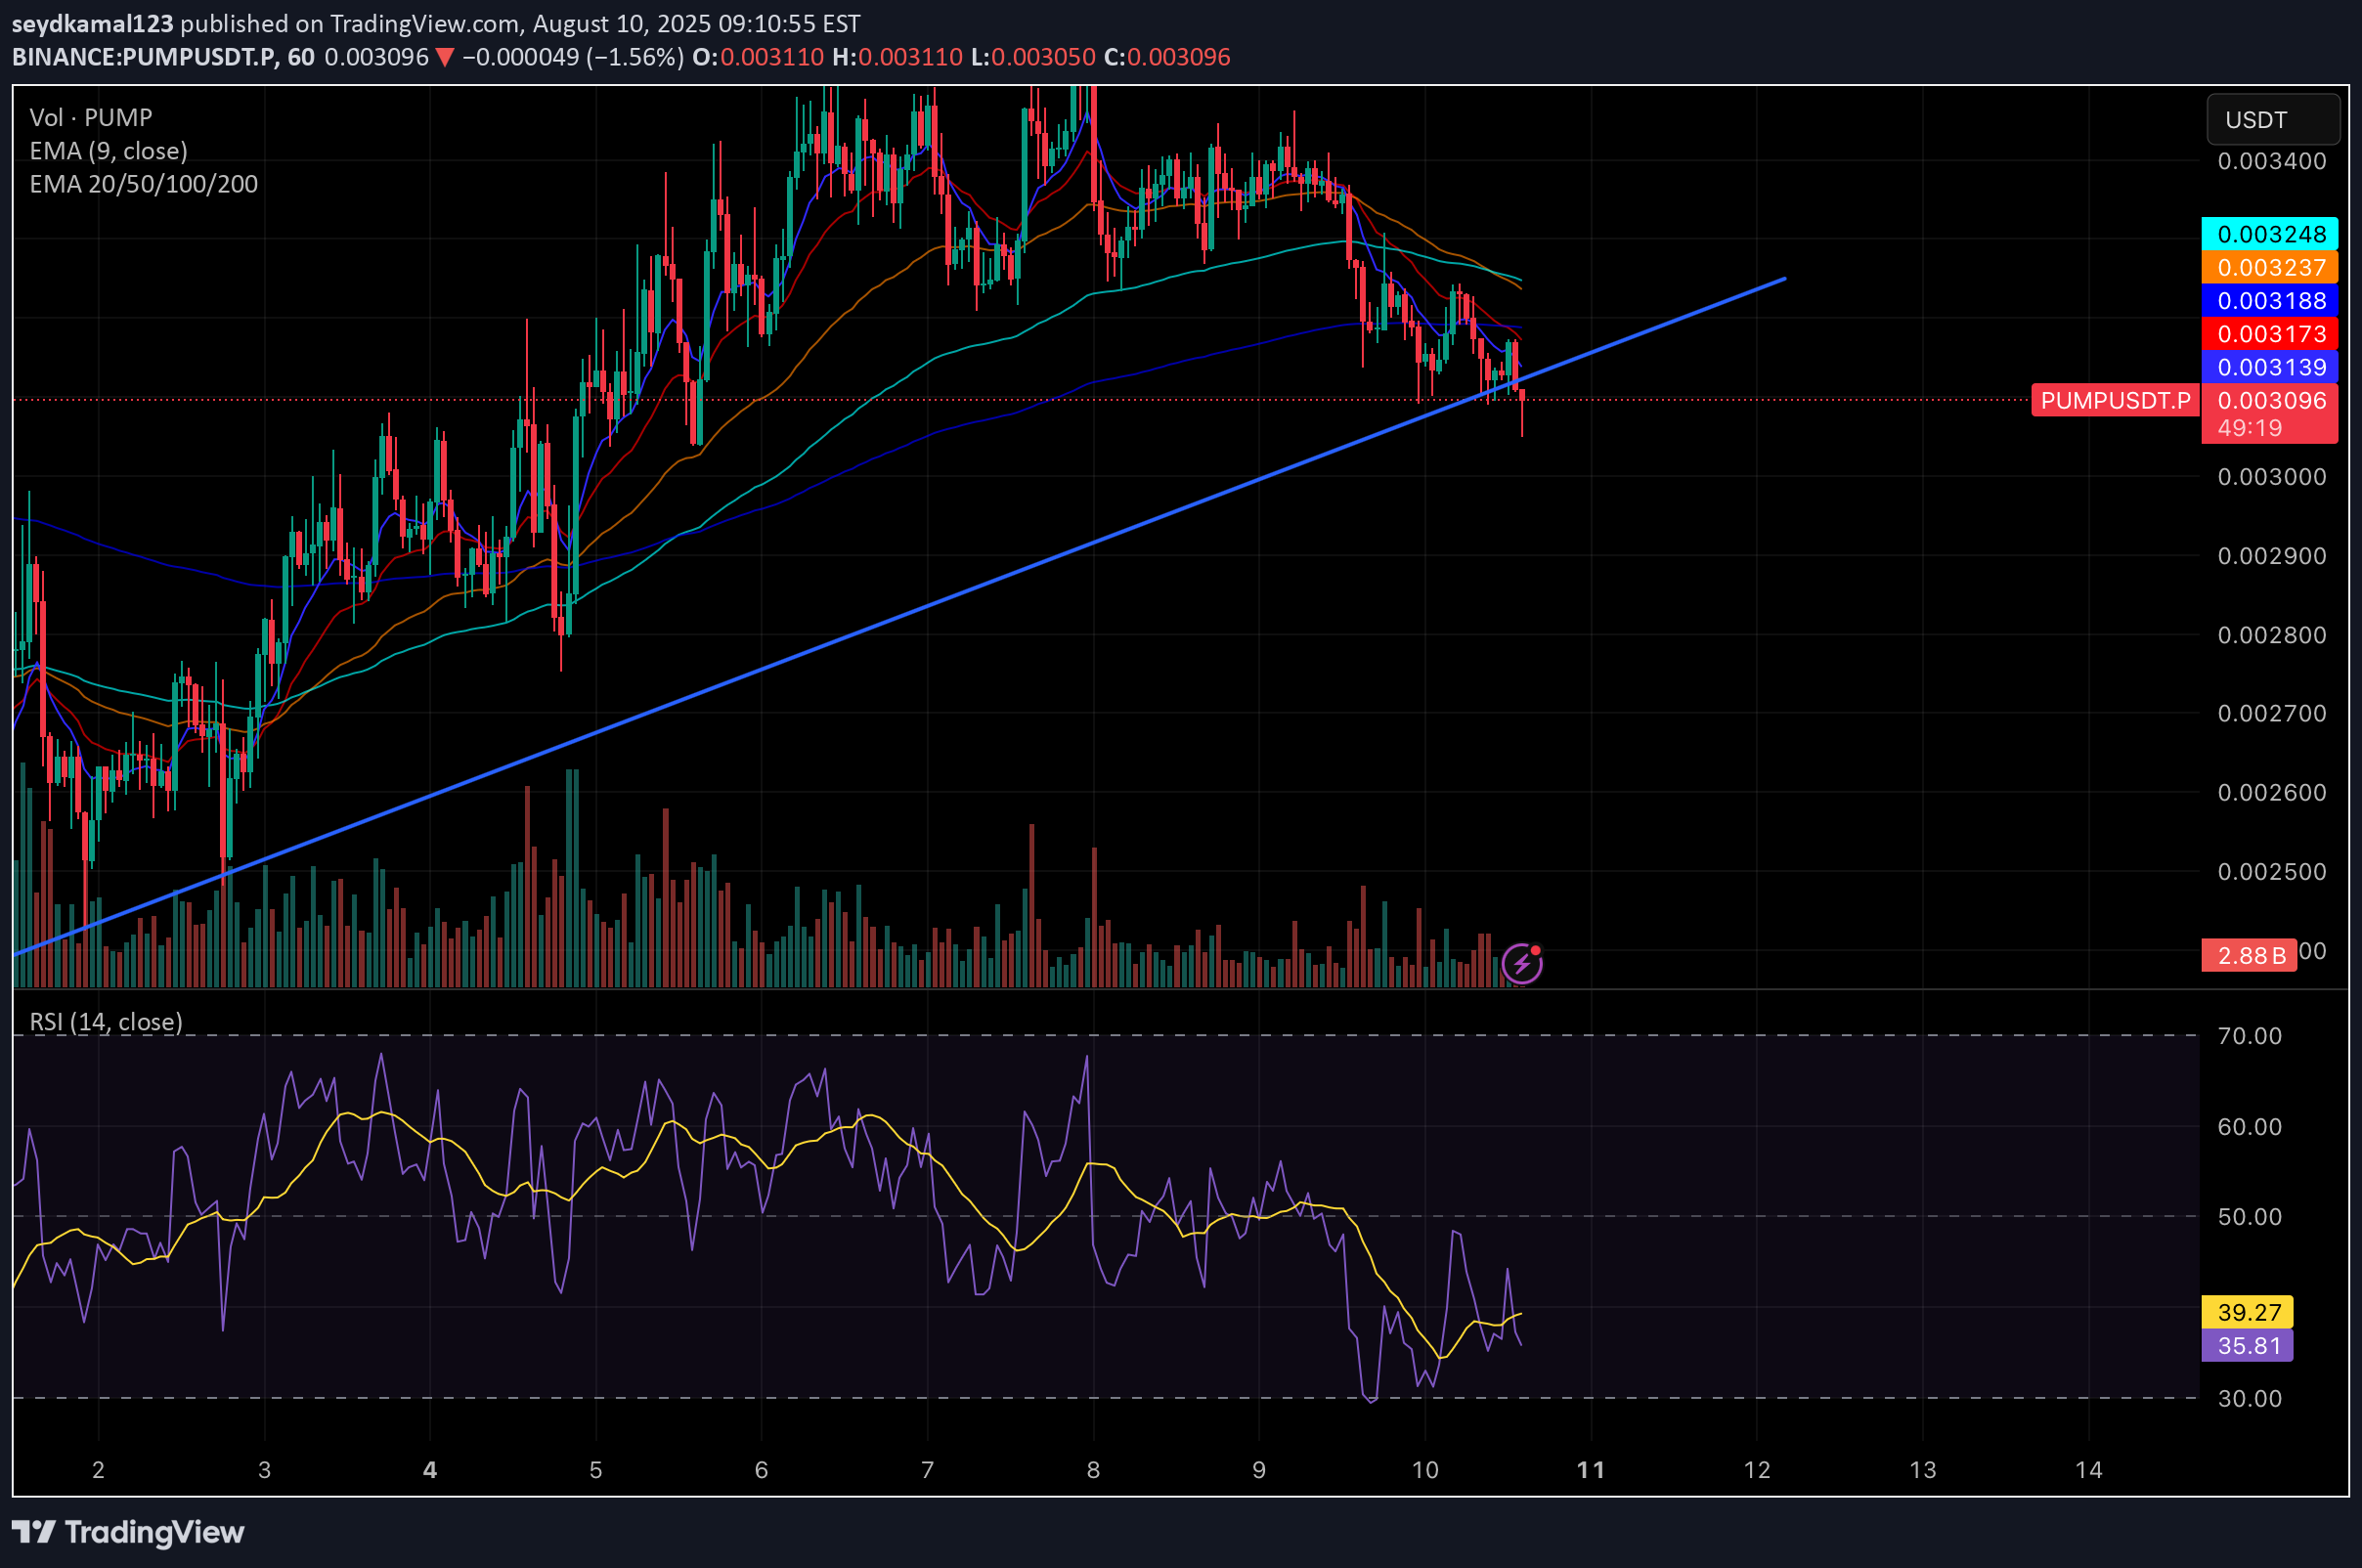
// version =5 strategy("EMA crossover + RSI filter (Long/Sell) — Simple", overlay=true, default_qty_type=strategy.percent_of_equity, default_qty_value=10, initial_capital=10000) // ======= INPUTS (قابل تغییر) ======= fastLen = input.int(9, "Fast EMA length") slowLen = input.int(21, "Slow EMA length") rsiLen = input.int(14, "RSI length") rsiLongMin= input.int(45, "Min RSI for Long (filter)") rsiShortMax= input.int(55, "Max RSI for Short (filter)") useShorts = input.bool(false,"Allow Shorts? (if OFF: only close longs on sell)") atrLen = input.int(14, "ATR length (for SL)") atrMult = input.float(2.0,"ATR multiplier (for SL)") takeProfitR = input.float(1.5, "Take Profit (x ATR)", step=0.1) tradeSizePct = input.float(10, "Position size (% equity)", step=0.1) // ======= INDICATORS ======= emaFast = ta.ema(close, fastLen) emaSlow = ta.ema(close, slowLen) rsiVal = ta.rsi(close, rsiLen) atrVal = ta.atr(atrLen) // plot EMAs plot(emaFast, title="EMA Fast", linewidth=2) plot(emaSlow, title="EMA Slow", linewidth=2) // ======= SIGNALS ======= // Long signal: EMA fast cross above slow AND RSI above filter longSignal = ta.crossover(emaFast, emaSlow) and (rsiVal >= rsiLongMin) // Sell/Short signal: EMA fast cross below slow AND RSI below filter shortSignal = ta.crossunder(emaFast, emaSlow) and (rsiVal <= rsiShortMax) // ======= ENTRY / EXIT ======= // position sizing strategy.risk.allow_entry_in(strategy.direction.long) strategy.risk.allow_entry_in(strategy.direction.short) strategy.order_info(true) strategy.exit_on_close(true) strategy.set_max_bars_back(math.max(fastLen, slowLen, rsiLen, atrLen)) // compute SL and TP price levels (absolute) longStopPrice = close - atrVal * atrMult longTPPrice = close + atrVal * takeProfitR shortStopPrice = close + atrVal * atrMult shortTPPrice = close - atrVal * takeProfitR // manage position sizing strategy.risk.allow_entry_in(strategy.direction.long) strategy.risk.allow_entry_in(strategy.direction.short) strategy.order_info(true) strategy.entry("Long", strategy.long, qty_percent=tradeSizePct, when=longSignal) if useShorts strategy.entry("Short", strategy.short, qty_percent=tradeSizePct, when=shortSignal) else // اگر شورت فعال نیست، سیگنال شورت فقط باعث بستن لانگ میشود if shortSignal strategy.close("Long", comment="CloseLong_on_ShortSignal") // exits for entries (only if the position exists) // apply TP/SL with strategy.exit (referencing entry id) strategy.exit("Long_exit", from_entry="Long", stop=longStopPrice, limit=longTPPrice) if useShorts strategy.exit("Short_exit", from_entry="Short", stop=shortStopPrice, limit=shortTPPrice) // ======= VISUAL ======= plotshape(longSignal, title="Long Signal", location=location.belowbar, color=color.new(color.green,0), style=shape.labelup, text="LONG") plotshape(shortSignal, title="Sell/Short Signal", location=location.abovebar, color=color.new(color.red,0), style=shape.labeldown, text="SELL") // RSI panel rsiPlot = plot(rsiVal, title="RSI", display=display.none) // hide in price pane h1 = hline(50, "RSI 50", color=color.gray, linestyle=hline.style_dotted) // ======= ALERTS ======= alertcondition(longSignal, title="Long Signal", message="EMA crossover + RSI => LONG") alertcondition(shortSignal, title="Sell Signal", message="EMA crossover + RSI => SELL/SHORT") // ======= INFO (print small label) ======= var table info = table.new(position.bottom_right, 1, 1) if barstate.islast table.cell(info, 0, 0, text="EMA: " + str.tostring(fastLen) + "/" + str.tostring(slowLen) + " RSI:" + str.tostring(rsiLen) + " ATRx:" + str.tostring(atrMult), text_color=color.white, bgcolor=color.new(color.blue,60))
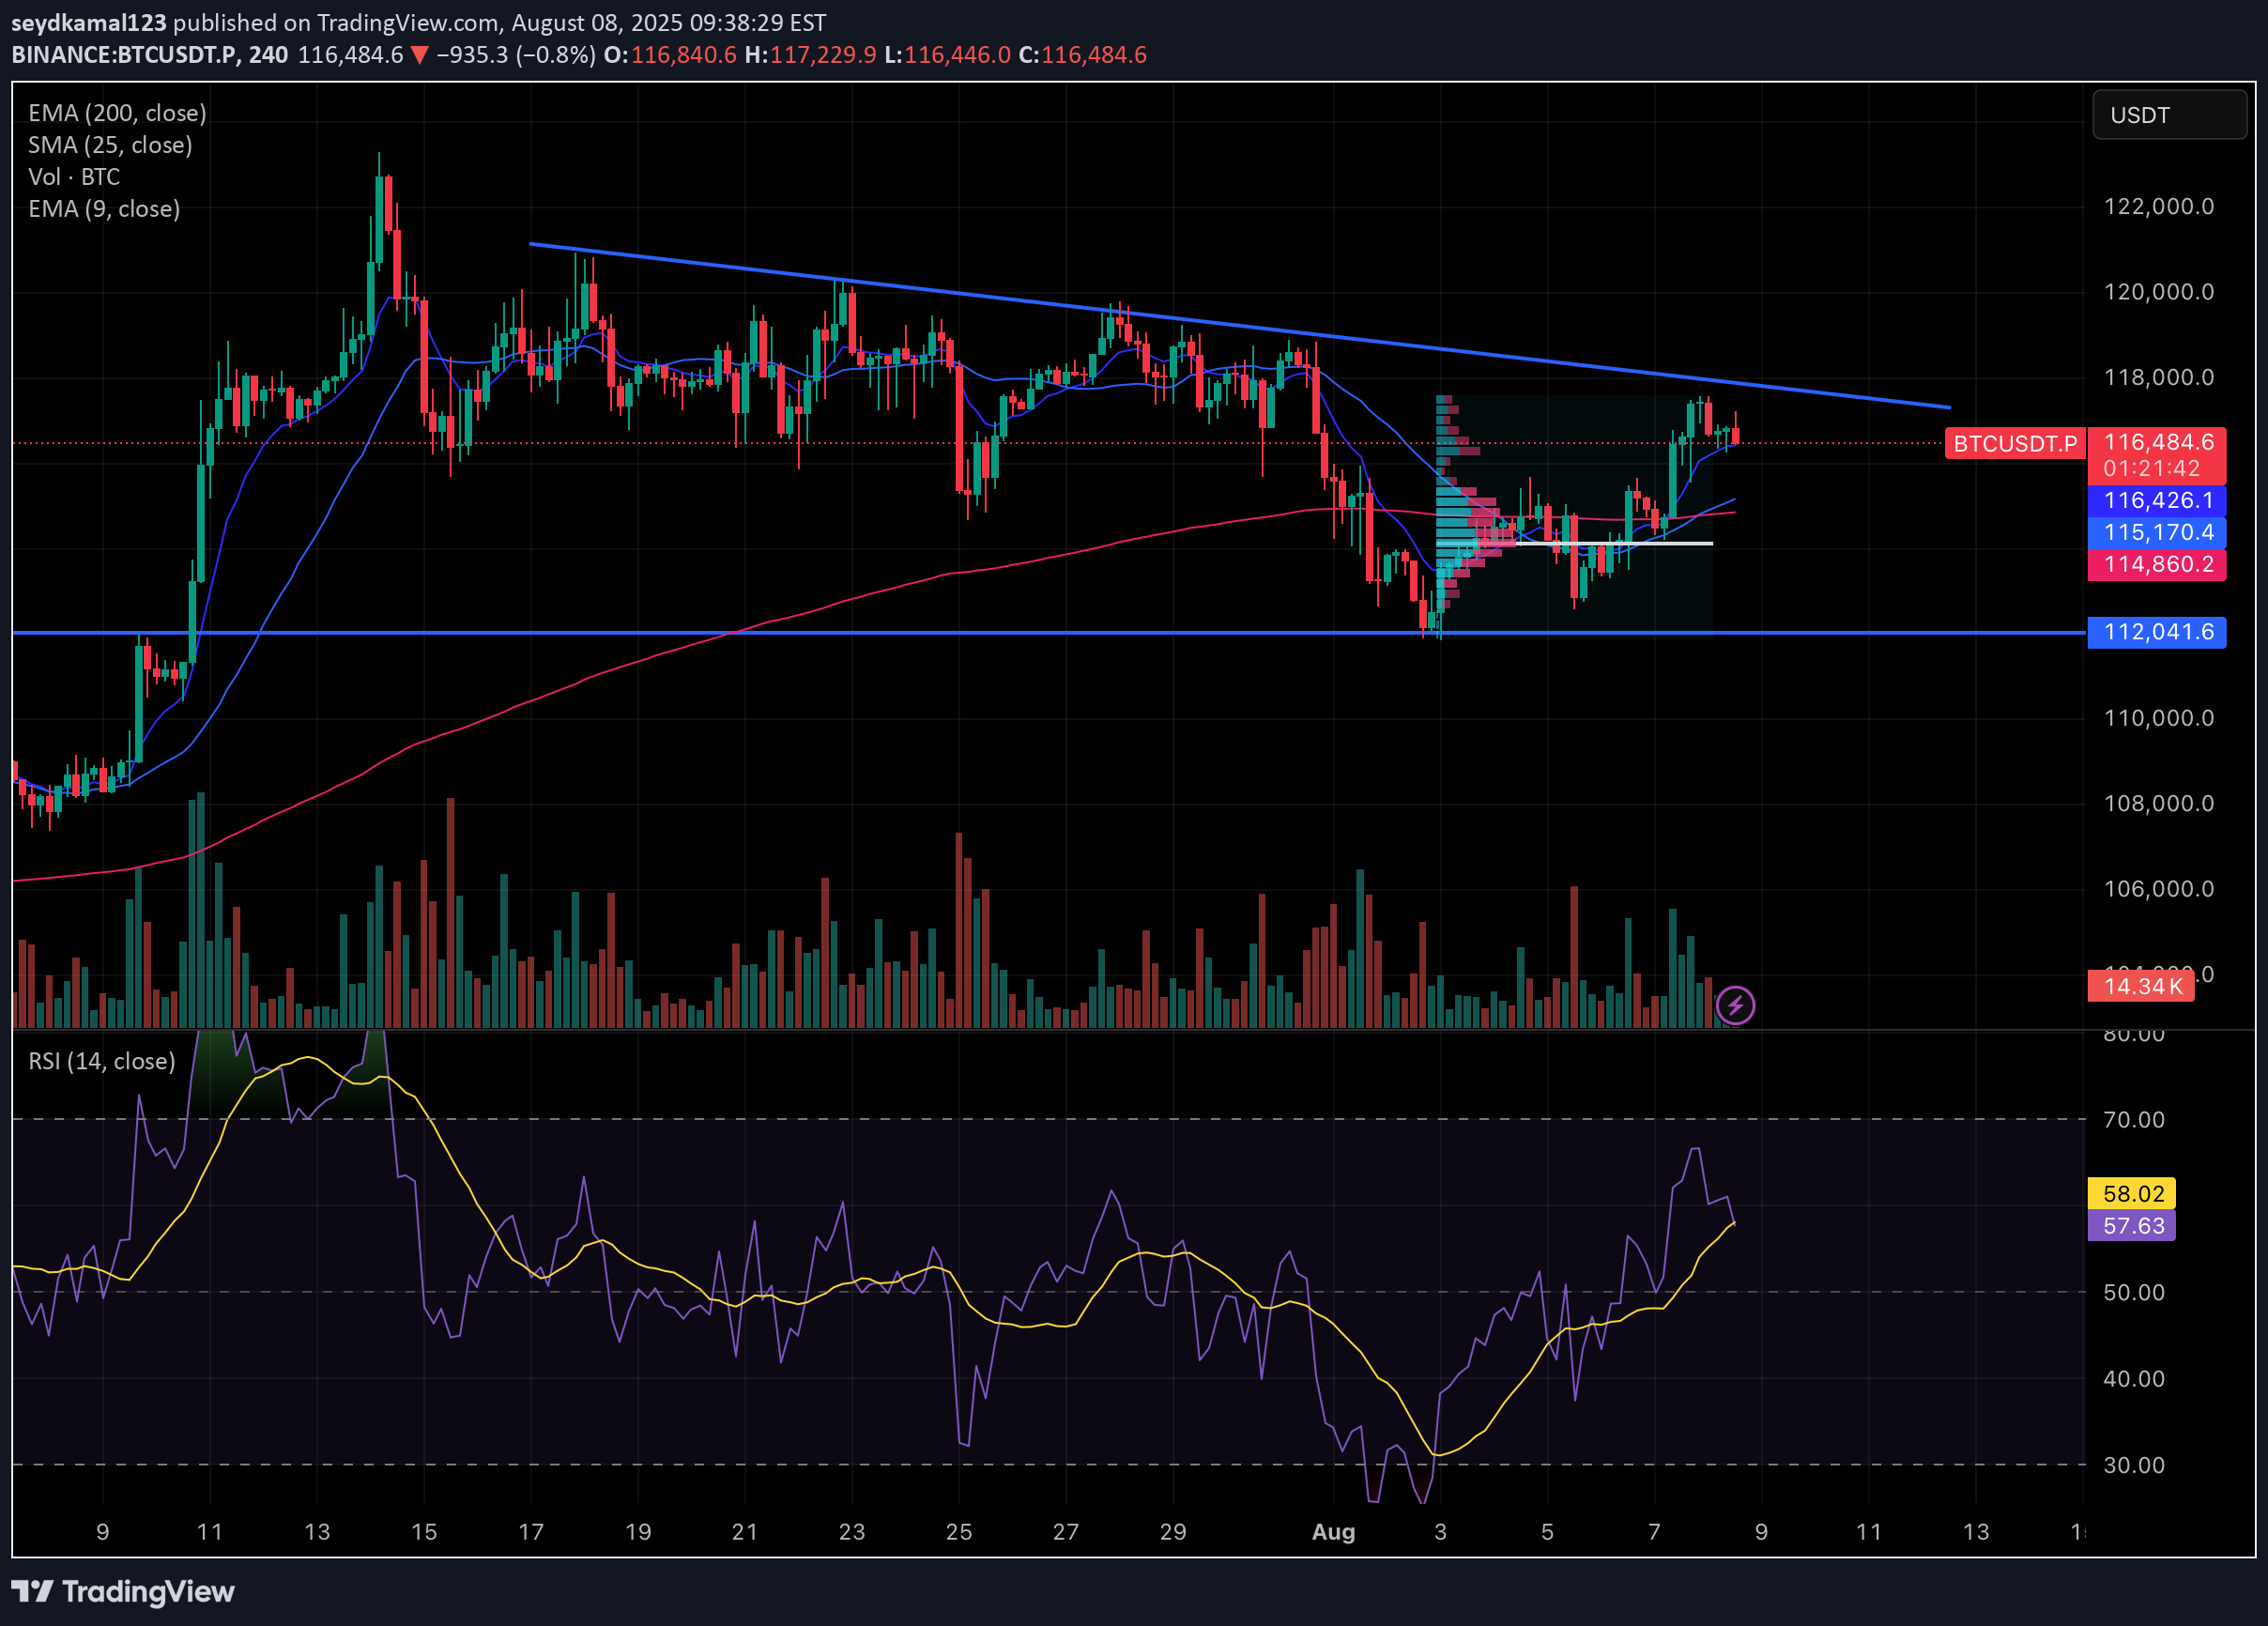
// version =6 indicator("TCP | Market Session | Session Analyzer", overlay=true, max_labels_count=500) // ───────────── 🕒 Minutes-to-Hours Helper Box group_minutes = "🕒 Minutes to Hours Helper" // Input: Minutes convertMinutes = input.int(90, "🛠️ Convert Minutes", minval=0, tooltip="Helper to convert minutes into hours (HH:MM)") // Conversion convertedHours = convertMinutes / 60.0 convertedHH = math.floor(convertMinutes / 60) convertedMM = convertMinutes % 60 convertedString = str.tostring(convertedHH, "00") + ":" + str.tostring(convertedMM, "00") // ───────────── تنظیمات جلسات group_sessions = "🌐 Session Settings (UTC - Minutes)" asiaStartMin = input.int(0, "Asia Start Time (UTC, minutes)", group=group_sessions, tooltip="Start of Asia session in minutes from midnight UTC.\nExample: 0 = 00:00 UTC") asiaEndMin = input.int(480, "Asia End Time (UTC, minutes)", group=group_sessions, tooltip="End of Asia session in minutes from midnight UTC.\nExample: 480 = 08:00 UTC") euroStartMin = input.int(420, "Europe Start Time (UTC, minutes)", group=group_sessions, tooltip="Start of Europe session in minutes from midnight UTC.\nExample: 420 = 07:00 UTC") euroEndMin = input.int(960, "Europe End Time (UTC, minutes)", group=group_sessions, tooltip="End of Europe session in minutes from midnight UTC.\nExample: 960 = 16:00 UTC") usStartMin = input.int(780, "US Start Time (UTC, minutes)", group=group_sessions, tooltip="Start of US session in minutes from midnight UTC.\nExample: 780 = 13:00 UTC") usEndMin = input.int(1260, "US End Time (UTC, minutes)", group=group_sessions, tooltip="End of US session in minutes from midnight UTC.\nExample: 1260 = 21:00 UTC") // ───────────── سایر تنظیمات maxPastDays = input.int(3, "Number of Past Days to Show Lines", minval=1, maxval=30) futureDays = input.int(2, "Number of Future Days to Show Lines", minval=0, maxval=10) labelYOffset = input.int(5, "Base Label Y Offset (ticks)", minval=1) labelSpacing = input.int(20, "Label Spacing Between Types (ticks)", minval=0) lookbackBars = input.int(20, "Lookback Bars for Max High", minval=1) useLocalTimezone = input.bool(false, "Use Chart's Local Timezone") showSessionLines = input.bool(true, "Show Vertical Session Lines") // ───────────── تنظیمات نمایش showAsiaSession = input.bool(true, "Show Asia Session") showEuropeSession = input.bool(true, "Show Europe Session") showUSSession = input.bool(true, "Show US Session") showLiquidityGrab = input.bool(true, "Show Liquidity Grab Labels") showCountdownTable = input.bool(true, "Show Countdown Table") showSessionBoxes = input.bool(true, "Show Session Boxes") // ───────────── رنگها asiaColor = color.new(color.green, 0) euroColor = color.new(color.orange, 0) usColor = color.new(color.blue, 0) asiaBoxColor = color.new(color.green, 85) euroBoxColor = color.new(color.orange, 85) usBoxColor = color.new(color.blue, 85) // تابع تشخیص حضور کندل در سشن tMin = useLocalTimezone ? (hour(time) * 60 + minute(time)) : (hour(time, "GMT+0") * 60 + minute(time, "GMT+0")) inSession(startMin, endMin) => (tMin >= startMin and tMin < endMin) // تابع تحلیل رفتار سشن f_behavior(_high, _low, _open, _close) => volatility = ta.stdev(close, 14) lowThreshold = volatility * 0.4 highThreshold = volatility * 0.8 rng = _high - _low body = math.abs(_close - _open) isTrend = body > rng * 0.4 and rng > highThreshold isConsolidation = rng < lowThreshold isManipulation = ((_high > _close and _low < _open) and body < rng * 0.4 and not isTrend) behavior = isTrend ? (_close > _open ? "Trend Up" : "Trend Down") : isConsolidation ? "Consolidation" : isManipulation ? "Manipulation" : "Range" behavior // ───────────── شکار نقدینگی lookbackLG = 12 highestPrev = ta.highest(high [1], lookbackLG) lowestPrev = ta.lowest(low [1], lookbackLG) useAtr = ta.atr(14) avgVolume = ta.sma(volume, 20) liqGrabUp = high > highestPrev and close < highestPrev liqGrabDown = low < lowestPrev and close > lowestPrev basicSignal = (liqGrabUp or liqGrabDown) strengthFilter = (high - low > useAtr * 0.6) and (volume > avgVolume * 1.05) confirmReversal = (liqGrabUp and close [1] < open [1]) or (liqGrabDown and close [1] > open [1]) liqGrabFinal = basicSignal and strengthFilter and confirmReversal var int lastSignalBar = na canPlotLabel = na(lastSignalBar) or (bar_index - lastSignalBar > 6) if showLiquidityGrab and liqGrabFinal and canPlotLabel label.new(bar_index, high, "Liquidity Grab", style=label.style_label_down, color=color.red, textcolor=color.white, size=size.tiny) lastSignalBar := bar_index // ───────────── تایمر پایان سشن getSessionEndTime(endMin) => timestamp(year(time), month(time), dayofmonth(time), math.floor(endMin / 60), endMin % 60) float timeLeftInSession = na if (showAsiaSession and inSession(asiaStartMin, asiaEndMin)) or (showEuropeSession and inSession(euroStartMin, euroEndMin)) or (showUSSession and inSession(usStartMin, usEndMin)) timeLeftInSession := (getSessionEndTime( inSession(asiaStartMin, asiaEndMin) ? asiaEndMin : inSession(euroStartMin, euroEndMin) ? euroEndMin : usEndMin) - time) / 60000 // ───────────── جدول شمارش معکوس getMinutesUntilSession(startMin) => nextTime = timestamp(year(time), month(time), dayofmonth(time), math.floor(startMin / 60), startMin % 60) nextTime < time ? (nextTime + 24 * 60 * 60 * 1000 - time) / 60000 : (nextTime - time) / 60000 currentSession = inSession(asiaStartMin, asiaEndMin) ? "Asia" : inSession(euroStartMin, euroEndMin) ? "Europe" : inSession(usStartMin, usEndMin) ? "US" : "None" float nextAsia = getMinutesUntilSession(asiaStartMin) float nextEuro = getMinutesUntilSession(euroStartMin) float nextUS = getMinutesUntilSession(usStartMin) nextSessionName = "" nextSessionIn = 0.0 if nextAsia < nextEuro and nextAsia < nextUS nextSessionName := "Asia" nextSessionIn := nextAsia else if nextEuro < nextUS nextSessionName := "Europe" nextSessionIn := nextEuro else nextSessionName := "US" nextSessionIn := nextUS var table countdownTable = table.new(position.top_right, 2, 5) if showCountdownTable and barstate.islast table.cell(countdownTable, 0, 0, "🕓 Current Session", text_color=color.white, bgcolor=color.new(color.black, 80)) table.cell(countdownTable, 1, 0, currentSession != "None" ? currentSession : "No Session", text_color=color.white, bgcolor=color.new(color.black, 60)) table.cell(countdownTable, 0, 1, "⏳ Time Left", text_color=color.white, bgcolor=color.new(color.black, 80)) table.cell(countdownTable, 1, 1, not na(timeLeftInSession) and currentSession != "None" ? str.tostring(math.max(timeLeftInSession, 0), "#.0") + " min" : "-", text_color=color.white, bgcolor=color.new(color.black, 60)) table.cell(countdownTable, 0, 2, "🔜 Next Session", text_color=color.white, bgcolor=color.new(color.black, 80)) table.cell(countdownTable, 1, 2, nextSessionName, text_color=color.white, bgcolor=color.new(color.black, 60)) table.cell(countdownTable, 0, 3, "⏱ Opens In", text_color=color.white, bgcolor=color.new(color.black, 80)) table.cell(countdownTable, 1, 3, str.tostring(math.round(nextSessionIn)) + " min", text_color=color.white, bgcolor=color.new(color.black, 60)) table.cell(countdownTable, 0, 4, text="Input: " + str.tostring(convertMinutes) , text_color=color.white, bgcolor=color.blue) table.cell(countdownTable, 1, 4, text="Converted: " + str.tostring(convertedHours, "#.##") + "h (" + convertedString + ")", text_color=color.white, bgcolor=color.blue) // ───────────── ذخیره دادههای سشن var float asiaHigh = na var float asiaLow = na var float asiaOpen = na var float asiaClose = na var string asiaResult = "Pending" var float euroHigh = na var float euroLow = na var float euroOpen = na var float euroClose = na var string euroResult = "Pending" var float usHigh = na var float usLow = na var float usOpen = na var float usClose = na var string usResult = "Pending" maxHigh = ta.highest(high, lookbackBars) fallbackHigh = na(maxHigh) ? close : maxHigh // ───────────── Box متغیرها var box asiaBox = na var box euroBox = na var box usBox = na // آسیا if showAsiaSession if inSession(asiaStartMin, asiaEndMin) asiaHigh := na(asiaHigh) ? high : math.max(asiaHigh, high) asiaLow := na(asiaLow) ? low : math.min(asiaLow, low) asiaOpen := na(asiaOpen) ? open : asiaOpen asiaClose := close if showSessionBoxes if na(asiaBox) asiaBox := box.new(bar_index, high, bar_index, low, bgcolor=asiaBoxColor, border_color=color.new(color.green, 70)) else box.set_right(asiaBox, bar_index) box.set_top(asiaBox, math.max(box.get_top(asiaBox), high)) box.set_bottom(asiaBox, math.min(box.get_bottom(asiaBox), low)) else if inSession(asiaStartMin, asiaEndMin) [1] and not inSession(asiaStartMin, asiaEndMin) asiaResult := f_behavior(asiaHigh, asiaLow, asiaOpen, asiaClose) asiaHigh := na asiaLow := na asiaOpen := na asiaClose := na asiaBox := na // اروپا if showEuropeSession if inSession(euroStartMin, euroEndMin) euroHigh := na(euroHigh) ? high : math.max(euroHigh, high) euroLow := na(euroLow) ? low : math.min(euroLow, low) euroOpen := na(euroOpen) ? open : euroOpen euroClose := close if showSessionBoxes if na(euroBox) euroBox := box.new(bar_index, high, bar_index, low, bgcolor=euroBoxColor, border_color=color.new(color.orange, 70)) else box.set_right(euroBox, bar_index) box.set_top(euroBox, math.max(box.get_top(euroBox), high)) box.set_bottom(euroBox, math.min(box.get_bottom(euroBox), low)) else if inSession(euroStartMin, euroEndMin) [1] and not inSession(euroStartMin, euroEndMin) euroResult := f_behavior(euroHigh, euroLow, euroOpen, euroClose) euroHigh := na euroLow := na euroOpen := na euroClose := na euroBox := na // آمریکا if showUSSession if inSession(usStartMin, usEndMin) usHigh := na(usHigh) ? high : math.max(usHigh, high) usLow := na(usLow) ? low : math.min(usLow, low) usOpen := na(usOpen) ? open : usOpen usClose := close if showSessionBoxes if na(usBox) usBox := box.new(bar_index, high, bar_index, low, bgcolor=usBoxColor, border_color=color.new(color.blue, 70)) else box.set_right(usBox, bar_index) box.set_top(usBox, math.max(box.get_top(usBox), high)) box.set_bottom(usBox, math.min(box.get_bottom(usBox), low)) else if inSession(usStartMin, usEndMin) [1] and not inSession(usStartMin, usEndMin) usResult := f_behavior(usHigh, usLow, usOpen, usClose) usHigh := na usLow := na usOpen := na usClose := na usBox := na // زمان سشنها getSessionTimestamp(sessionMin, dayOffset) => dayMs = 24 * 60 * 60 * 1000 baseDay = timestamp(year(time), month(time), dayofmonth(time), 0, 0) baseDay + dayOffset * dayMs + sessionMin * 60 * 1000 drawVerticalLineEx(_time, _color, _label, _style, _transp) => if not na(_time) line.new(x1 = _time, y1 = close * 1.2, x2 = _time, y2 = close * 0.8, xloc = xloc.bar_time, extend = extend.none, color = color.new(_color, _transp), width = 2, style = _style) isSessionStart(startMin, endMin) => inSession(startMin, endMin) and not inSession(startMin, endMin) [1] isSessionEnd(startMin, endMin) => not inSession(startMin, endMin) and inSession(startMin, endMin) [1] // رسم خطوط // رسم خطوط (تنظیم مستقل) if showSessionLines for dayOffset = -maxPastDays to futureDays transp = dayOffset < 0 ? math.min(90, math.abs(dayOffset) * 10) : dayOffset == 0 ? 0 : 40 if showAsiaSession drawVerticalLineEx(getSessionTimestamp(asiaStartMin, dayOffset), asiaColor, "Asia Session Start", line.style_dotted, transp) drawVerticalLineEx(getSessionTimestamp(asiaEndMin, dayOffset), asiaColor, "Asia Session End", line.style_solid, transp) if showEuropeSession drawVerticalLineEx(getSessionTimestamp(euroStartMin, dayOffset), euroColor, "Europe Session Start", line.style_dotted, transp) drawVerticalLineEx(getSessionTimestamp(euroEndMin, dayOffset), euroColor, "Europe Session End", line.style_solid, transp) if showUSSession drawVerticalLineEx(getSessionTimestamp(usStartMin, dayOffset), usColor, "US Session Start", line.style_dotted, transp) drawVerticalLineEx(getSessionTimestamp(usEndMin, dayOffset), usColor, "US Session End", line.style_solid, transp) // برچسبها tick = syminfo.mintick if showAsiaSession if isSessionStart(asiaStartMin, asiaEndMin) label.new(bar_index, fallbackHigh + tick * labelYOffset, "Asia Session Start", style=label.style_label_up, color=asiaColor, textcolor=color.white, size=size.normal) if isSessionEnd(asiaStartMin, asiaEndMin) label.new(bar_index, fallbackHigh + tick * (labelYOffset + labelSpacing), "Asia Session End: " + asiaResult, style=label.style_label_up, color=asiaColor, textcolor=color.white, size=size.normal) if showEuropeSession if isSessionStart(euroStartMin, euroEndMin) label.new(bar_index, fallbackHigh + tick * (labelYOffset + 2 * labelSpacing), "Europe Session Start", style=label.style_label_up, color=euroColor, textcolor=color.white, size=size.normal) if isSessionEnd(euroStartMin, euroEndMin) label.new(bar_index, fallbackHigh + tick * (labelYOffset + 3 * labelSpacing), "Europe Session End: " + euroResult, style=label.style_label_up, color=euroColor, textcolor=color.white, size=size.normal) if showUSSession if isSessionStart(usStartMin, usEndMin) label.new(bar_index, fallbackHigh + tick * (labelYOffset + 4 * labelSpacing), "US Session Start", style=label.style_label_up, color=usColor, textcolor=color.white, size=size.normal) if isSessionEnd(usStartMin, usEndMin) label.new(bar_index, fallbackHigh + tick * (labelYOffset + 5 * labelSpacing), "US Session End: " + usResult, style=label.style_label_up, color=usColor, textcolor=color.white, size=size.normal)
Disclaimer
Any content and materials included in Sahmeto's website and official communication channels are a compilation of personal opinions and analyses and are not binding. They do not constitute any recommendation for buying, selling, entering or exiting the stock market and cryptocurrency market. Also, all news and analyses included in the website and channels are merely republished information from official and unofficial domestic and foreign sources, and it is obvious that users of the said content are responsible for following up and ensuring the authenticity and accuracy of the materials. Therefore, while disclaiming responsibility, it is declared that the responsibility for any decision-making, action, and potential profit and loss in the capital market and cryptocurrency market lies with the trader.