Technical analysis by 💠 سامان تحلیل 💠 about Stock رنیک on 8/9/2025

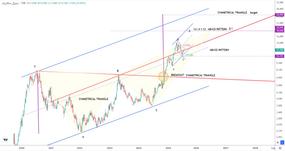
📈 Advanced Technical Analysis #Renic (General Mechanics) Weekly Time Freight | Logarithmic scale مان The #Renic icon in a fully technical structure *Price Action *, with the adaptation of the classic pattern, harmonic patterns and long -term channel structure, is on the path of a structural upward trend *. 🔺 Classic Symmetric Triangle: After the formation and aggregation of energy in the heart of the classic symmetrical triangle, with a definite Breakout in the 710 Tomans range, a powerful ascending wave began. The Target of this pattern is * Measured Move * at 24,500 Rials, which overlaps with the long -term uptrend channel ceiling. Harmonic patterns in you | Nested Harmonics: The overall structure of the chart in its heart has an AB = CD Extended pattern with a 4.3 % extension in the 18,038-18,046 area, which is in a larger and perennial harmonic pattern. The symmetry of the A and C points in the internal structure has reinforced the possibility of accurately completed the pattern. 📌 Breakpoint key zone: The level of 12,700 Rials acts as a recurrent resust. The powerful failure of the area was the main driver for activating Target Harmonic. 📉 Valid Technical Support: Level 1,280 Tomans (equal to a correction minor floor) and then 710 Tomans are known as static and dynamic demand zone. If it is lifted, the mid -term ascending structure will be threatened. Level 280 USD is also available as a macro base in the long -term structure of the chart. 📐 Final Speech: The #Renic chart is completing a multilayer structure of classic and harmonic patterns. If you cross the psychological and technical range of 2 Rials, the way to achieve the goals of 2 Rials (AB = CD) and finally 2 rials (Triangle and channel ceiling) paved. ╭━━ 🚀 @samantahlil members ╰━━ 💠 on the path of transformation ... 💠 💠
