
💠 سامان تحلیل 💠
@g_1006407295

پیام های تریدر
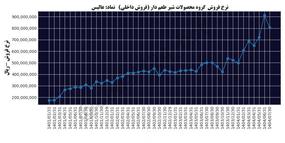
🟢 The increase in the selling price of milk in dairy companies is evident in the last few months, and in the next few days, the prices of milk for the month will be published ✔️ #Dairy #Alys #Ghfars #Ghpak #Ghshan #Ghashsefa ╭━━═━⊰✦ 🪐✦⊱━═━━╮ 🚀 @samantahlil👈 Subscribe ╰━━═━⊰❖🫥❖⊱━═━━╯ 💠 In the path of analysis, awareness and transformation... 💠
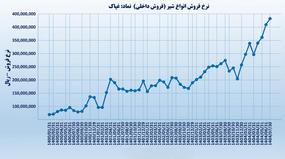
# Milk and rate increase 🔼 The sales price of all kinds of Ghapak symbol milk actually shows an upward trend and it shows that the price of milk in October has also continued to increase, and it has definitely been rising in November as well. The increase in the price of raw milk and animal inputs has caused the increase in the price of milk 🟪 The November sales report of livestock farms and dairies was definitely interesting ╭━━═━⊰✦ 🪐✦⊱━═━━╮ 🚀 @samantahlil👈 Subscribe ╰━━═━⊰❖🫥❖⊱━═━━╯ 💠 In the path of analysis, awareness and transformation... 💠
Hojatullah Saidi, head of the stock exchange organization: ✅ The President will come to the opening ceremony of the Stock Exchange Conference tomorrow, Saturday, December 1st, on the occasion of Stock Exchange and Capital Market Week The capital market week starts from the 1st to the 7th of December. The opening ceremony of the capital market conference will be held on Saturday, December 1, with the presence of senior officials of the government and the stock exchange organization, at 8:00 a.m. in the Sedosaima conference hall. ✳️ Footnote: The stock market week and the conference celebrating the stock market and the presence of the president in the conference promises a green stock market week. ╭━━═━⊰✦ 🪐✦⊱━═━━╮ 🚀 @samantahlil👈 Subscribe ╰━━═━⊰❖🫥❖⊱━═━━╯ 💠 In the path of analysis, awareness and transformation... 💠
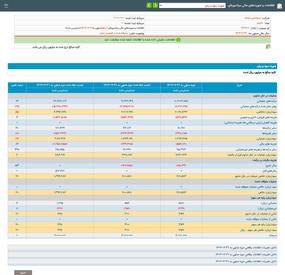
#Dabur Aburihan Pharmaceuticals 📊 6-month interim activity report ending on 06/31/1404 🔥 Dabur's masterpiece with a jump of 217% net profit! Functional summary: The company appeared beyond expectations in the first half of the fiscal year 1404. Revenue growth along with excellent cost control led to attractive profit margins and impressive growth in net profit. 📈 Details of key figures (million Rials): Operating income: 17,308,350 (▲ 84% growth compared to the previous similar period) 🔴 Final price: (8,129,027) (▲ 46% growth | Positive point: cost growth is half of income growth) 🟢 Gross profit: 9,179,323 (▲ 139% explosive growth) 🟢 Net profit: 5,588,056 (▲ 217% super jump) 💎 Net profit per share (EPS): 3,104 rials (Excellent coverage in the first 6 months) 📊 Profit margin analysis (indicator of management quality): • Gross profit margin: 53% (up from 41% last year) • Net profit margin: 32% (up from 19% last year) 👈 The company was able to make 32 Tomans of net profit for every 100 Tomans sold, which is a great record. 🔎 Important analytical points: 1️⃣ Profitable gap: 38% gap between sales rate growth and cost price growth has been the main engine of profit making. 2️⃣ profit quality: operating profit constitutes the major share of net profit, which indicates the health of the company's income stream. 3️⃣ Operating leverage: With fixed costs relatively constant, increased sales have been injected directly into net profit. 💡 Summary: With this report, Dabur showed that it is one of the most fundamental shares of the pharmaceutical group this year. Maintaining a 53% profit margin in the second half of the year can make the forward P/E of the stock extremely attractive. 🏷 #analysis ╭━━═━⊰✦ 🪐✦⊱━═━━╮ 🚀 @samantahlil👈 Subscribe ╰━━═━⊰❖🫥❖⊱━═━━╯ 💠 In the path of analysis, awareness and transformation... 💠
#Ghazer has achieved 291 rials in the audited 6 months, which is 158% more than the same period last year. ╭━━═━⊰✦ 🪐✦⊱━═━━╮ 🚀 @samantahlil👈 Subscribe ╰━━═━⊰❖🫥❖⊱━═━━╯ 💠 In the path of analysis, awareness and transformation... 💠
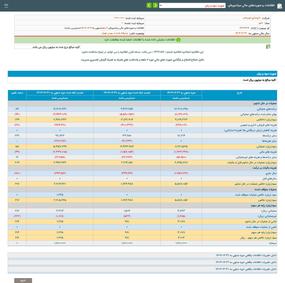
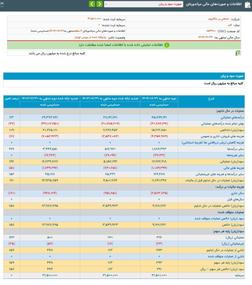
Auditor explanation: The details of 1-5 and 2-1-6 finances, identifying oil products to/ and buying crude oil from the National Payment Company and the distribution of Iranian oil products during the finance period based on the announcement of the moon and estimates for the months of August and the city of urbanization and urban and in financial faces. The 2-1-6 does not include 419 billion rials for 5 percent of the feed of crude oil. On the other hand, the description of the explanatory notes 1-1-1-24 and 2-1-1-24 Financial forms of the accounts of the accounts per unit reported unit with the company with the company said the amount of 371 billion rials is contrary to the perceptions of the Financial Affairs Organization accounts of the accounts of the company for the taxes of the National Reliance Company and the distribution of Iranian oil products to the amount 011 37 billion rials, 160 billion rials from pure bought and sales bills and 200 billion rials from the ID cards identified for the years 2010 and 2010 in the offices of the company in 1400 according to the declaration of the company. Also, the company has provided 6 check clauses in the amount of 637 and 35 billion rials to the organization, which according to a letter No. 68257 on 22/07/1404 Palish Company and broadcast Iranian oil products to the coffers of the whole country, the request for the account of these harvesting exposures as the settlement of 1403 1403 1403 oil companies We have made the price of crude oil and oil products (in the implementation of the provisions of the dam (Ja) of the 2004 budget law of the total year 1404 of the country). The issue of applying the account is caused by financial perceptions and differences during the process, and the lack of belonging to the roads to refineries companies is a process of calculations during the country's calculations. The provisions of the dam have no effect on the comments. - 🚀 @samantahlil - In the path of analysis, awareness and transformation ...

📊 #Shelred | 6-month performance report: operational jump under the shadow of financial costs The symbol of "Ure Lordegan Chemical Fertilizer" published its audited report for 6 months ending on 31 September 1404. A review of the financial statements reveals a great paradox: "brilliant operations versus a costly financial structure." 🔎 Key points and detailed analysis: 1️⃣ Income jump and cost control: The company recorded an operating income of 69,670 billion Rials, a stunning growth of 110% compared to the same period last year. The more positive point is that the total price has only grown by 82%. This significant gap between revenue growth and cost growth has led to a significant improvement in gross profit margin. 2️⃣ gross profit; Report star: Gross profit has reached about 35,000 billion Rials with a jump of 147%. 📈 Gross profit margin: 50% (excellent growth compared to 43% of the previous period). This shows that the core of the business (production and sale of urea) is in its best condition and the company has been successful in pricing and managing production costs. 3️⃣ Achilles heel: heavy financial expenses: But why does this great operation not end in net profit? The answer is in the heading "financial costs". In 6 months, the company has recognized a heavy amount of 19,515 billion Rials in financial expenses (51% increase in financial expenses). This huge figure has practically swallowed a large part of the operating profit. 4️⃣ other non-operational expenses (exchange rate loss?): The loss figure of 7,292 billion Rials in the heading "Other income and non-operating expenses" has also dealt the final blow. Probably, the major part of this figure is related to the currency exchange loss of the company's foreign currency debts, which continues to weigh heavily on the financial statement. 5️⃣🔴 Final result: loss reduction, but still in the red zone Finally, the company has identified a net loss of 4,809 billion Rials (534 Rials per share). Although we have improved compared to the loss of the same period last year (43%) and the depth of the loss has decreased, Shellard still could not get out of the loss zone. 💡 Summary and strategy: Shellard is a very strong and growing company in terms of operations (production and sales). 50% gross profit margin is great for a petrochemical company. The main problem is the capital structure and foreign currency and Rial debts. • Positive point: the improvement of the net profit margin from minus 25% to minus 7% shows that the company is on the right track to get out of losses. • Signal: If the company can find a solution to settle the facilities or reduce financial costs (such as capital increase or liquidation), due to this high operating potential, it can quickly reach high profitability. For now, it is the appropriate watchlist symbol to monitor changes in the financial structure. #chemical_fertilizer_urea_lordgan #borsalil_fundamental #financial_face #Kedal #petrochemical 🆔 @samantahlil ╭━━═━⊰✦ 🪐✦⊱━═━━╮ 🚀 @samantahlil👈 Subscribe ╰━━═━⊰❖🫥❖⊱━═━━╯ 💠 In the path of analysis, awareness and transformation... 💠
🚨 The time bomb of the automobile industry is on the verge of explosion; 40 Hemti housing or artificial respiration? The crisis in Iran's automotive industry has entered a new and dangerous phase. While the total accumulated losses and debts of car manufacturers have reached an astronomical figure of 620 thousand billion tomans (620 hemets), the news of the injection of 40 hemets of credit in the fall of 1404 has brought sharp reactions from economic experts. 📊 Crisis autopsy: 1️⃣ Liquidity crisis or hidden bankruptcy? The figure of 620 debt has practically exceeded the value of the assets of many of these companies. According to accounting principles, this situation means that companies are subject to Article 141 of the Commercial Law (bankruptcy). The injection of 40 hemets covers only about 6.5% of this huge hole, which is practically a drop in the ocean. 2️⃣ Inflationary Impact: The financing of 40 hemmati, if it comes from the central bank's resources (monetary base), directly led to the creation of new liquidity and increased general inflation. This means that the cost of inefficiency of car manufacturers is paid again by "people" through inflation. 3️⃣ Suppression of production and supply chain: As the beating heart of the industry, component manufacturers are the biggest creditors of this story. The failure to settle the demands of the parts makers has led to a decrease in production circulation, a sharp drop in quality, and an increase in defective cars in parking lots. These 40 efforts were probably only spent on paying arrears and preventing labor strikes, not a jump in production. 4️⃣ signal to the capital market (Stock Market Effect): For automotive shareholders (market leaders), this news has two sides: • Short-term: Maybe it creates a temporary buying excitement (positive swing). • Long-term: Without reforming the mandated pricing structure and real handover of management, loss-making continues and future financial statements remain in the red. ⚠️ outlook and warning: Experts believe that these "trickle-down supports" only delay the time of the explosion. Without economic surgery (removal of mandated pricing + actual privatization), the auto industry has become a "well" for the country's banking resources that will not be filled no matter what they pour into it. Final note: Investors in automotive symbols should be alert; This injection of liquidity is not a "cure" but simply buys time. The systematic risk of this group is still at the highest level. 🔗 Source: Banker 🆔 @samantahlil #cars #bourse #economy_of_Iran #fundamental_analysis #Saipa #Iran_cars #inflation ╭━━═━⊰✦ 🪐✦⊱━═━━╮ 🚀 @samantahlil👈 Subscribe ╰━━═━⊰❖🫥❖⊱━═━━╯ 💠 In the path of analysis, awareness and transformation... 💠
📊 6-month performance analysis report of #Sharum (audited - ending 06/31/1404) Urmia Petrochemical; The growth of net profit under the heavy shadow of the cost price and the reduction of the production margin Urmia Petrochemical Company with the symbol #Sharum published the audited financial statements of the first half of 1404. The report contains contradictory notes of "weakness in core operations" and "success in controlling ancillary costs" that led to nominal net profit growth. In the operating income section, the company managed to register 10,303 billion Rials, which shows a 13% growth compared to the same period last year. But the Achilles heel of the report lies in the unbalanced growth of the finished price; where the production costs have increased with an acceleration of 19% (more than the income growth). This disproportion has led to compression of the profitability spring and reduced the company's gross profit to 2,091 billion Rials with a decrease of 5%. The direct result of this is the drop in gross profit margin from 24% to 20%, which is a warning sign for operational efficiency. But what prevented the company's final profit from falling is the successful management of the downstream costs of the profit and loss statement. 1. Controlling sales and administrative costs: this heading has been associated with a decrease of about 4%, which is a positive point. 2. Reduction of financial costs: the company has managed to reduce its financial costs by 14% (from 649 to 556 billion Rials), which indicates the settlement of part of the facilities or better management of liquidity. 3. Non-operating income jump: 390% growth of other incomes and reaching 65 billion rials, has helped to compensate for the operational weakness. Finally, the result of these factors has caused the company's net profit to reach 718 billion Rials with a growth of 20% and profit per share to 359 Rials. Although the 20% growth in net profit is attractive at first glance, considering the 7% decrease in operating profit and relying on the reduction of financial expenses and miscellaneous income, it can be said that the quality of profit has decreased compared to the previous period. Conclusion: #Sharum's performance can be described as "defensive". The company has retreated in the front line of production (gross profit), but by entrenching in financial and administrative expenses, it has been able to grow net profit. The "underperforming" tag is quite true for the operating segment, although the final output (Net Profit) is positive. The stability of the net profit margin at 7% shows that the company has been able to maintain the status quo for now, but for real growth, it needs to improve the product sales spread. ╭━━═━⊰✦ 🪐✦⊱━═━━╮ 🚀 @samantahlil👈 Subscribe ╰━━═━⊰❖🫥❖⊱━═━━╯ 💠 In the path of analysis, awareness and transformation... 💠

📊 3-month performance analysis report of Qalrost (ends 07/30/1404) Lorestan sugar; A stormy start with a 417% jump in revenues and an attractive profit margin Lorestan Sugar Company with the symbol #Qalrost, in the interim activity report of 3 months leading to the end of October 1404, recorded a stunning performance that exceeded expectations, which indicates a fundamental change in the income and operational flows of this company in the new fiscal year. In the mentioned time period, this company has managed to identify operating revenues of 5,758 billion Rials, which shows an extraordinary jump of 417% compared to the same period of the previous year (1,113 billion Rials). An important point in management clarifications is to mention the sale of product inventory at the beginning of the period, which was the driving force behind this revenue jump. In the cost sector, although we see a 368% increase in expenses and reach 3,971 billion Rials, the growth rate of incomes has exceeded the growth of expenses, which results in a 572% jump in gross profit. The gross profit of the company has reached a significant figure of 1,787 billion Rials from 265 billion Rials in the same period before. This performance has significantly improved the gross profit margin and stabilized it at 31%, which shows a growth of 28% in this key ratio compared to the previous season (24%) and indicates the correct management of sales rates and control of production costs. In the lower layers of the profit and loss statement, Qalrost still maintains its solid financial structure. Zero financial costs in this report is considered a great competitive advantage for this symbol, which shows that it does not depend on expensive bank facilities. Finally, the company has managed to realize a net profit of 1,708 billion Rials, which has experienced a growth of 247% compared to the profit of 492 billion Rials in the same period last year. Based on this, the net profit per share (EPS) has also reached 949 rials with a proportional jump. Conclusion: Although at first glance, the decrease in net profit margin compared to the previous quarter (from 44% to 30%) may be seen as a negative point (weak performance), it should be noted that this decrease was mainly caused by the nature of non-operating income in previous periods or a change in the sales mix. All in all, the leveraged growth of profitability, the sale of warehouse inventory at reasonable rates, and the lack of financial costs paint a very clear fundamental outlook for "Qalrost" for the rest of the fiscal year, and the "weak performance" tag may be a bit harsh considering the 247% growth in net profit, and it is better to call it "high operational quality performance". ╭━━═━⊰✦ 🪐✦⊱━═━━╮ 🚀 @samantahlil👈 Subscribe ╰━━═━⊰❖🫥❖⊱━═━━╯ 💠 In the path of analysis, awareness and transformation... 💠
Disclaimer
Any content and materials included in Sahmeto's website and official communication channels are a compilation of personal opinions and analyses and are not binding. They do not constitute any recommendation for buying, selling, entering or exiting the stock market and cryptocurrency market. Also, all news and analyses included in the website and channels are merely republished information from official and unofficial domestic and foreign sources, and it is obvious that users of the said content are responsible for following up and ensuring the authenticity and accuracy of the materials. Therefore, while disclaiming responsibility, it is declared that the responsibility for any decision-making, action, and potential profit and loss in the capital market and cryptocurrency market lies with the trader.