Technical analysis by RSI_Trading_point about Symbol PAXG: Sell recommendation (7/30/2025)

RSI_Trading_point
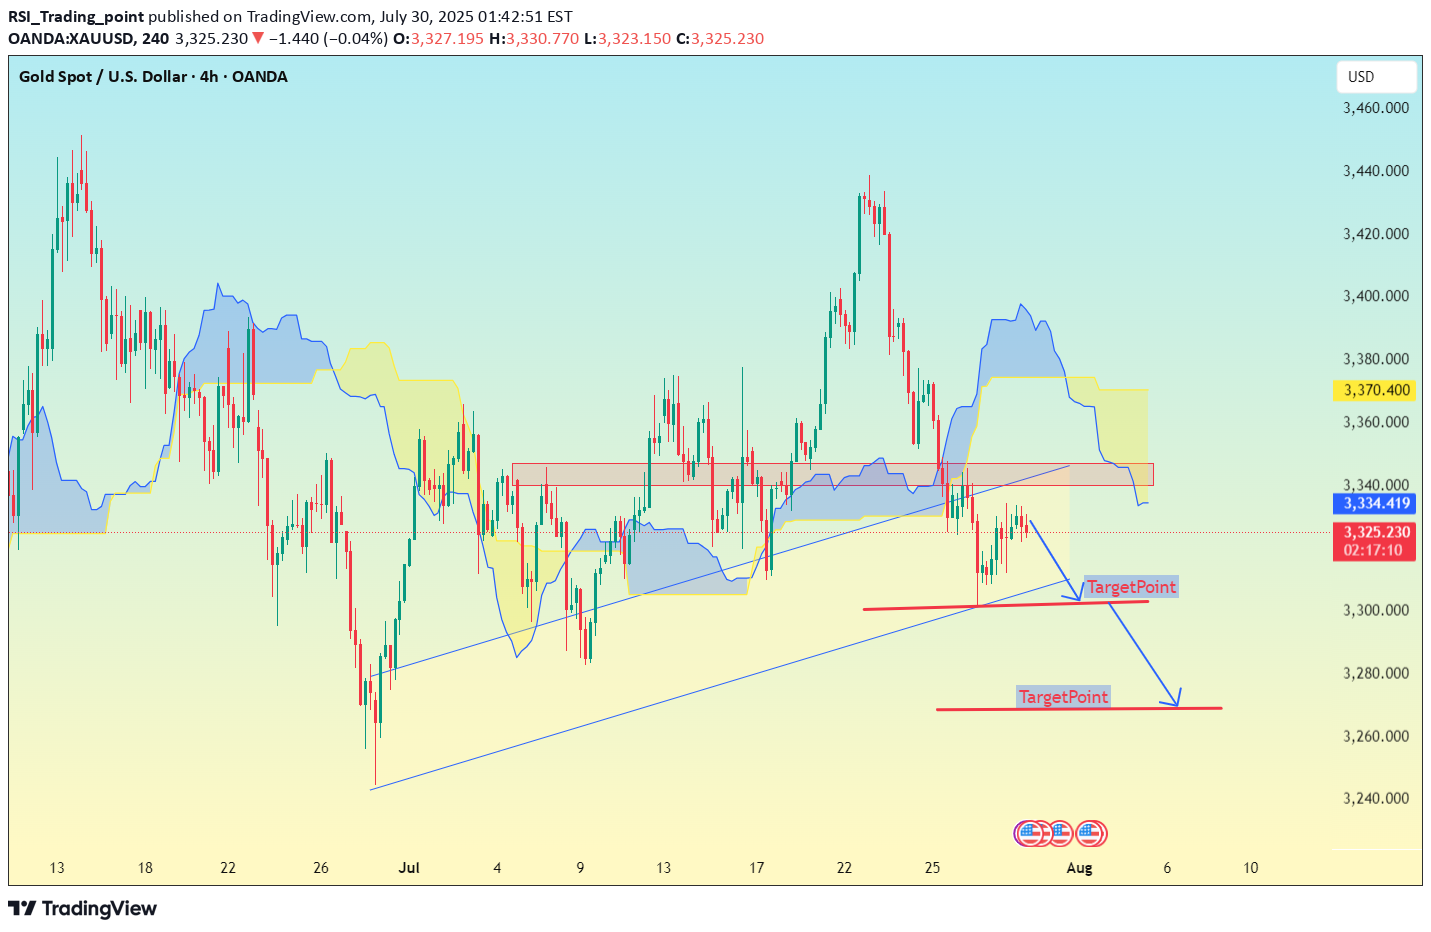
🔍 XAU/USD (Gold Spot vs US Dollar) Technical Analysis – 4H Chart Based on my shared image from TradingView, here's a detailed analysis of the current XAU/USD market scenario: --- 🧩 Chart Type & Indicators Used Timeframe: 4-Hour (H4) Platform: TradingView Indicators: Ichimoku Cloud Bollinger Bands (BB) Support/Resistance zones Trendlines Price Action with Target Points Marked --- 📉 Current Market Structure Price: ~$3,324 (Sell/Buy zone shown) Overall Trend: Turning bearish in the short term. Price Action: Price has broken below an ascending trendline, suggesting a shift from bullish to bearish momentum. The price is trading below the Ichimoku cloud, reinforcing a bearish bias. Failed retest of the cloud resistance zone (around 3,335–3,340), which now acts as a resistance. --- 🔻 Bearish Signals 1. Trendline Break: The rising trendline support (mid-July to now) is broken. This indicates a potential reversal from the previous bullish momentum. 2. Retest & Rejection: Price attempted to retest the breakdown zone and was rejected from the 3,335–3,340 level. 3. Ichimoku Cloud Bearish Setup: Price is clearly below the cloud. Future cloud is bearish (red shaded). Chikou Span (lagging line) is below price candles and cloud. --- 🎯 Targets First Target Point: ~3,300 This is the next horizontal support level (near recent lows). Final Target Point: ~3,270 Stronger support zone and measured move from breakdown. --- 🛡 Resistance Zone Immediate Resistance: 3,335–3,340 Stronger Resistance: 3,370 --- 📌 Conclusion The XAU/USD 4H chart shows a bearish breakout below the rising channel, with confirmation from Ichimoku and price rejection at cloud resistance. The market is targeting 3,300 as the first support, and if that breaks, 3,270 will likely follow. --- ✅ Strategy Suggestion (if trading): Bias: Short/Sell Entry: After a weak pullback or retest near 3,330–3,335 Targets: TP1: 3,300 TP2: 3,270 Stop Loss: Above 3,345 or near 3,350 zone Let me know if you'd like this in simpler terms or want me to track the next setup.
