Technical analysis by cryptodailyuk about Symbol MKR on 7/29/2025

cryptodailyuk
MKR/USDT 4H Chart

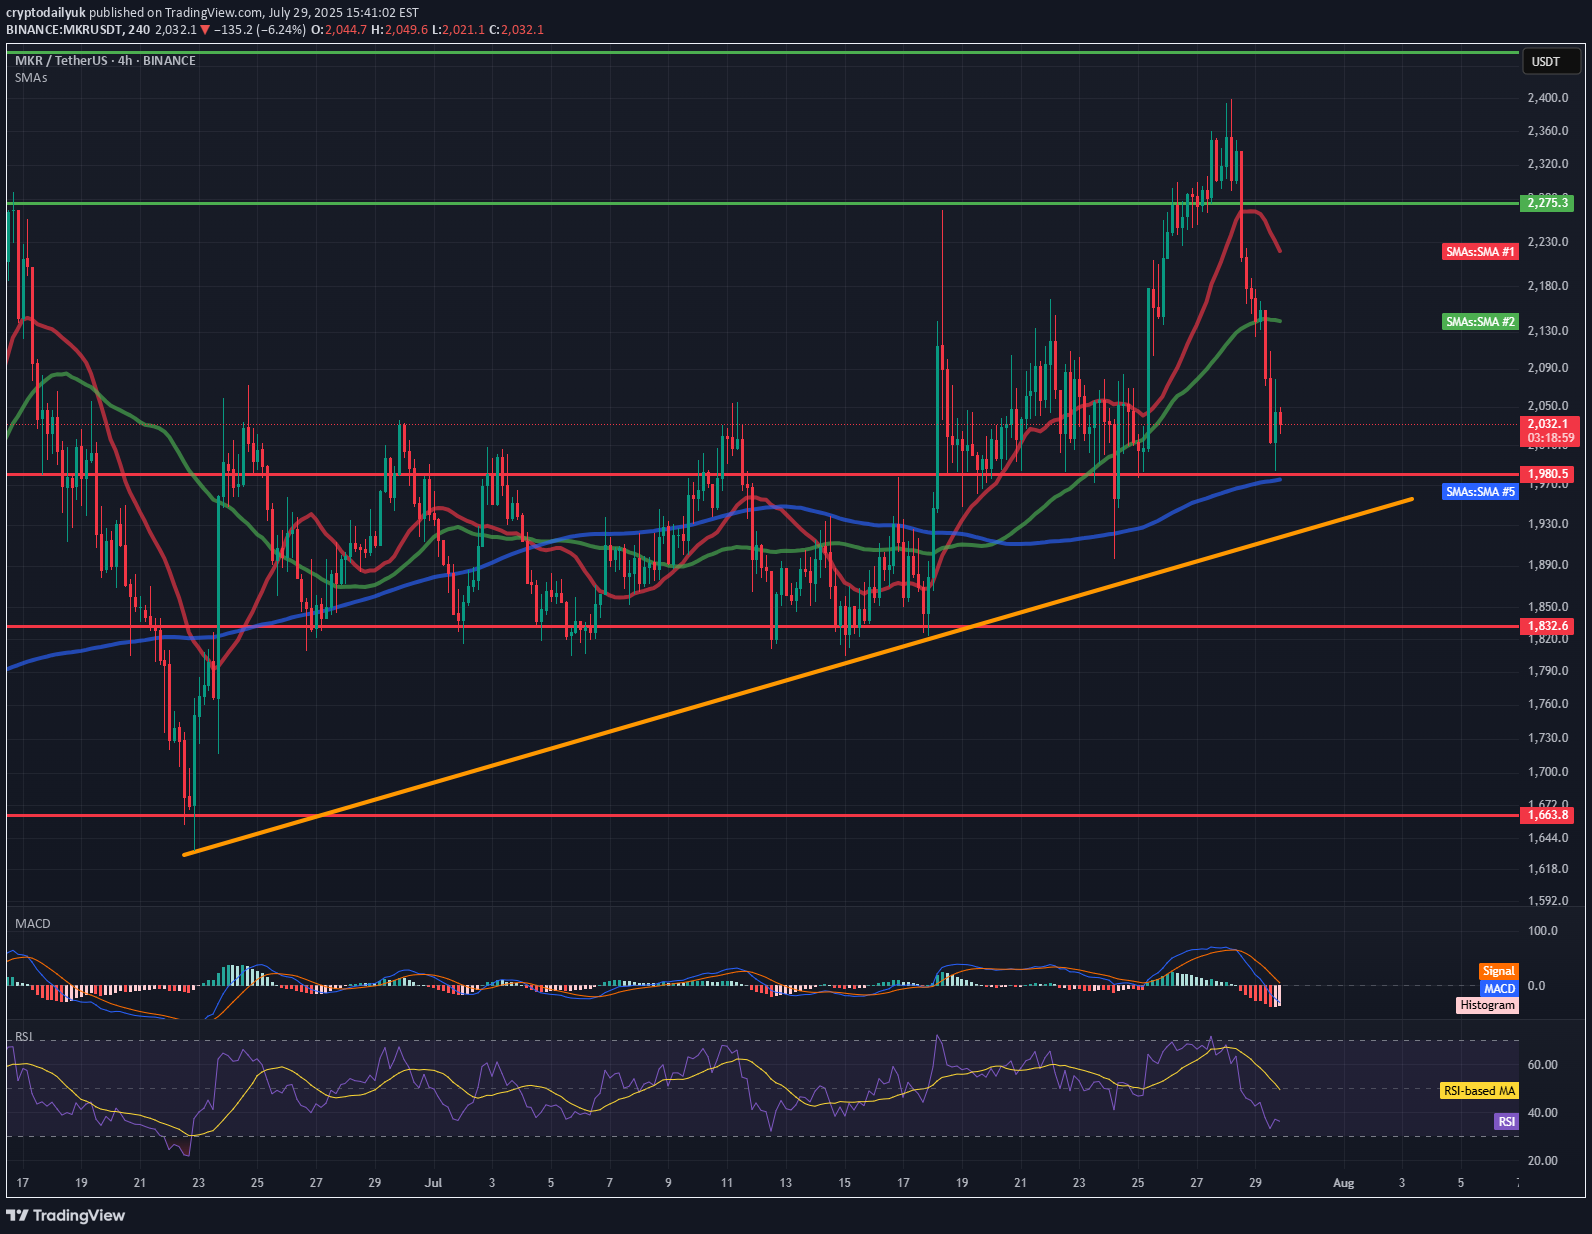
📉 Short-term situation: The price is currently trading around 2028 USDT, after a sharp decline from around 2273 USDT (resistance). The support level around 2000 USDT is currently being tested (coinciding with the SMA 200 – blue line). A dynamic uptrend line (orange) is also visible, which could act as a key support level in the event of further declines. 🔍 Support and Resistance Levels: Resistance: 🔴 2188 USDT – recent local high and convergence with the SMA 21. 🟢 2273 USDT – major resistance; previous rebound and point of significant price reaction. Support: 🔵 1980 USDT – local support + SMA200. 🟠 Uptrend line (~1940–1960 USDT). 🔴 1832 USDT – stronger horizontal support with multiple confirmations. 🔴 1623 USDT – very strong support, from previous lows. 📊 Technical indicators: RSI (Relative Strength Index): Current value: ~42, neutral, but approaching the oversold zone (<30). The RSI is falling rapidly, suggesting selling pressure, but a reaction is possible near current support. MACD: Negative signal: signal line crossing from above + descending histogram. Indicates a continuation of the correction, but we are approaching the potential exhaustion of the downward momentum. 📈 Moving averages: EMA/SMA 50 and 200: The price is currently testing the SMA200 – crucial for the medium-term trend. SMA21 (red) and SMA50 (green) – have reversed downward, which may suggest a weakening of bullish momentum. 🔮 Scenarios: 🟢 Bullish scenario (confirmation of support): A rebound from 1980–2000 USDT and further upward movement. Potential target: first ~2180 USDT, then ~2273 USDT. The condition is a demand response at the current level + an improvement in the RSI/MACD. 🔴 Bearish scenario (breakout of support): If the 1980 USDT level is broken and the price falls below the uptrend line, a continued decline to 1832 USDT or even lower is possible. Confirmation will be a strong bearish candle with high volume and a further decline in the RSI/MACD.