Technical analysis by Innotrade_AJ about Symbol SOL: Buy recommendation (7/29/2025)

Innotrade_AJ
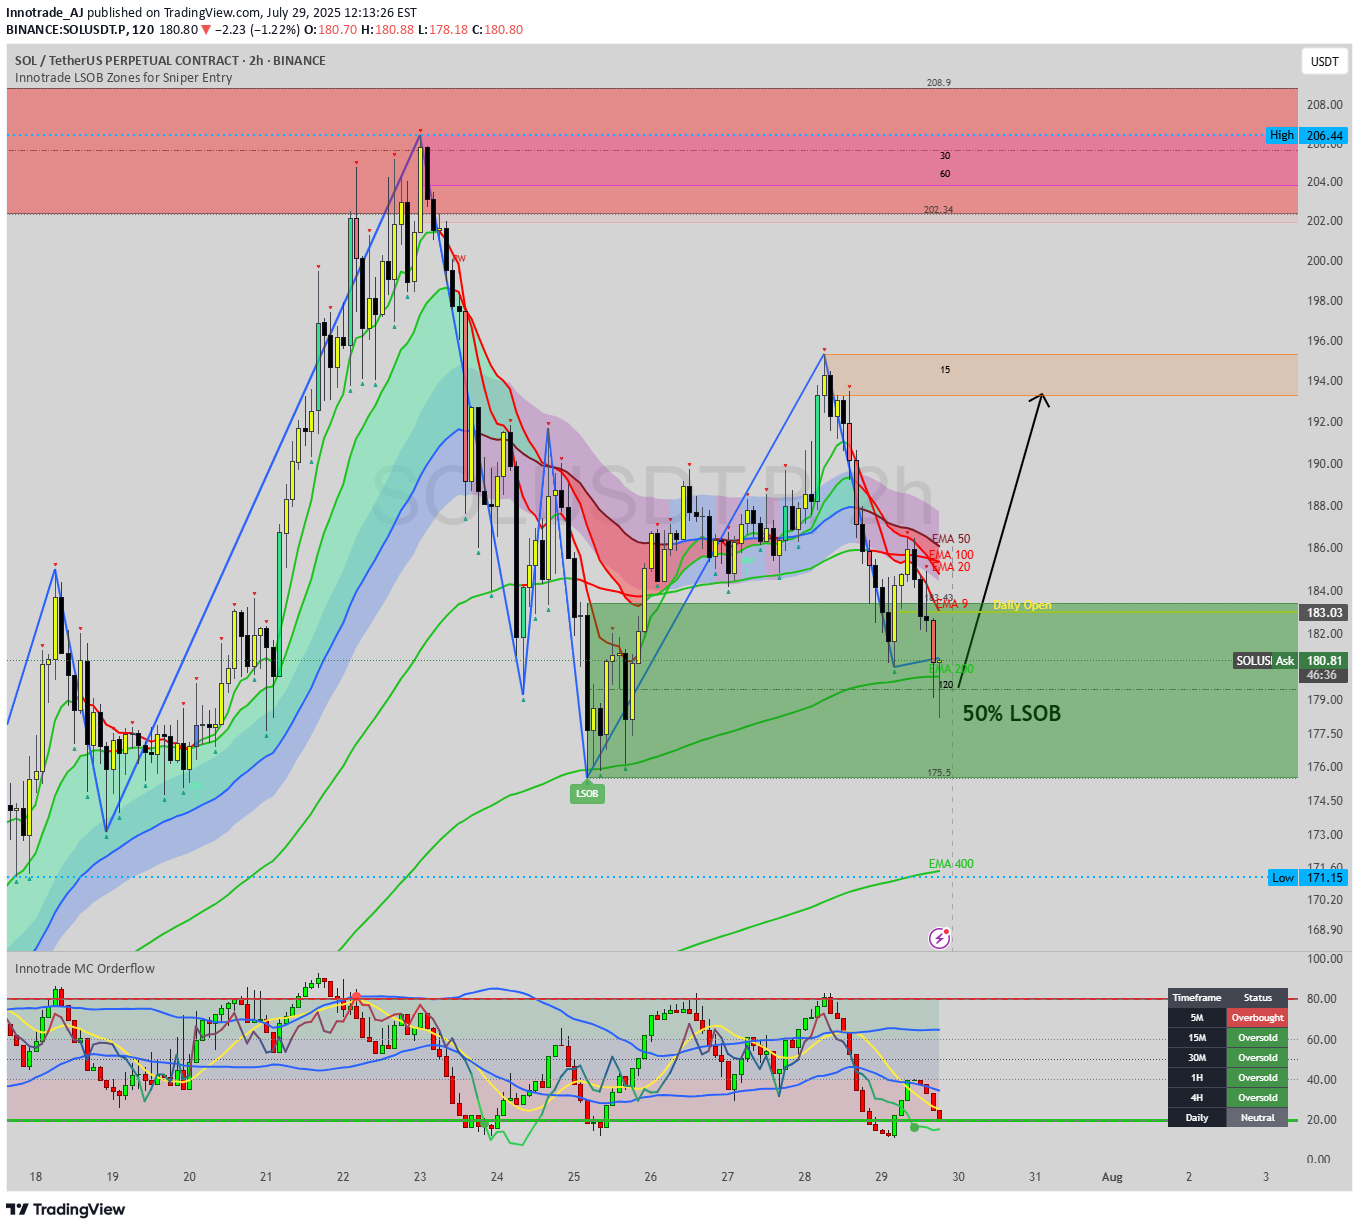
Hello, traders. Today we are examining Solana (SOL), which has just pulled back into a technically significant area of interest after a strong rejection from the $206 highs. While the recent drop has been sharp, it has brought the price into a major demand zone that aligns perfectly with key long-term support levels. This analysis provides a step-by-step breakdown of the confluent technical factors suggesting that the current level offers a high-probability opportunity for a bullish reversal and the continuation of the primary uptrend. The Analysis: Stacking the Bullish Confluences A robust trading idea is formed when multiple, independent technical signals align. On this 2-hour chart for SOL, we have a powerful convergence of factors: 1. Primary Market Structure (Uptrend Intact): First and foremost, the context is bullish. The Zig-Zag indicator clearly shows a well-defined uptrend with a series of higher highs and higher lows. The current price action, while corrective, is still holding above the previous major low. As long as this structure holds, our bias should be to buy the dips in anticipation of the next leg up. 2. The Institutional Demand Zone (LSOB): Price has now entered the large green LSOB (Liquidity Sweep Order Block), a critical zone spanning from roughly $175.5 to $183. These zones represent areas where significant buying interest and institutional order flow previously entered the market. The price has wicked directly into this demand zone, indicating a reaction from buyers. 3. Dynamic Support Confluence (The EMA 200): Adding immense strength to this demand zone is the EMA 200, which is flowing directly through the middle of the LSOB. The EMA 200 is a widely respected long-term moving average that often acts as powerful, dynamic support in an uptrend. The fact that price has respected this level almost to the dollar is a strong confirmation of its significance. 4. Multi-Timeframe Momentum Exhaustion: This is perhaps the most compelling timing signal. Our MC Orderflow oscillator is deep in the green "Oversold" territory, indicating that selling pressure on this timeframe is exhausted. More importantly, the Dashboard reveals that this condition is widespread. The 15M, 30M, 1H, and 4H timeframes are all simultaneously flashing "Oversold." This cross-timeframe alignment of momentum exhaustion is a powerful signal that the corrective move is likely nearing its end. 5. Fibonacci Time Cycle: A small but significant detail is the Fibonacci Time Cycle icon (the lightning bolt) that appeared near the recent low. These cycles can often mark key turning points in time, suggesting that the market is chronologically primed for a potential pivot. The Potential Trade Plan Based on this powerful stack of confluences, here is a potential trade plan: Entry Zone: The current LSOB / EMA 200 area, from $179 to $181, represents a strong zone for entries. Stop Loss: A logical stop loss can be placed just below the LSOB and the recent swing low, around $174.50. A break of this level would invalidate the bullish structure. Potential Targets: Target 1: A reclaim of the Daily Open at 186 Target 2: The intermediate supply zone and recent swing high around $194 - $196. Target 3: A full retest of the major high at $206. Conclusion We have a textbook example of technical confluence: a pullback to a major LSOB demand zone that aligns perfectly with the long-term EMA 200, all while multi-timeframe momentum indicators show clear seller exhaustion at a potential time-based turning point. This presents a compelling, high-probability case for a long position on Solana. Disclaimer: This analysis is for educational purposes only and does not constitute financial or investment advice. Trading involves a high level of risk. Always conduct your own thorough research and consult with a licensed financial advisor before making any trading decisions.
