Technical analysis by Innotrade_AJ about Symbol SUI: Buy recommendation (7/29/2025)

Innotrade_AJ
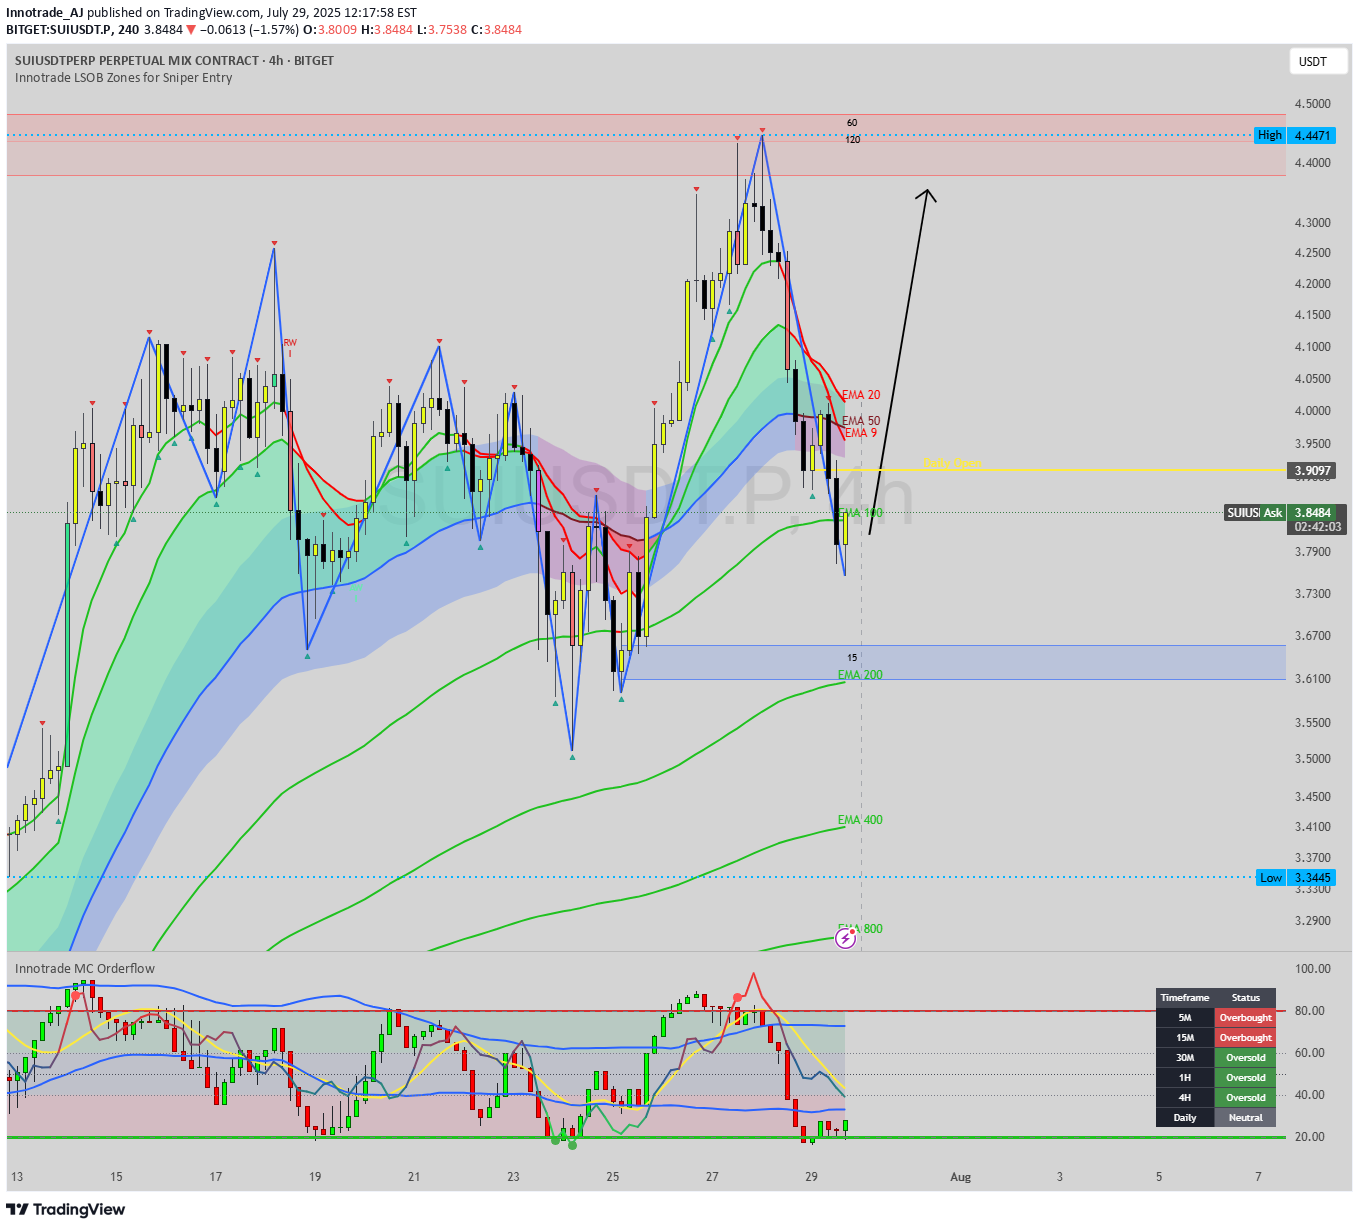
Hello, traders. Today, we're putting SUI under the microscope as it undergoes a sharp but healthy correction following an impressive rally. The price has recently broken below its short-term moving averages, and is now heading directly towards a powerful cluster of technical support. This is a classic "buy the dip" scenario unfolding. This analysis will provide a step-by-step breakdown of why the $3.60 - $3.70 zone represents a high-probability area for this corrective move to end, and for the primary bullish trend to resume. The Analysis: A Convergence of Powerful Signals The strongest trade ideas are not based on one signal, but on multiple, independent factors aligning. Here is the powerful confluence we are observing on the SUI 4H chart: 1. The Primary Bullish Structure: First, let's establish the market context. The Zig-Zag indicator confirms that the primary market structure is firmly bullish, with a clear series of higher highs and higher lows. The current move is a textbook corrective pullback within this uptrend. Our goal is not to fight the trend but to identify the most logical point for it to continue. 2. The Key Support Cluster (Order Block + EMA 200): The price is approaching a major floor of support. This floor is composed of two critical elements: Demand Zone / Order Block: There is a significant demand zone (the blue-shaded box) sitting between $3.60 and $3.70. This is an area where strong buying pressure previously entered the market, and it's likely to act as a solid support level. The EMA 200: Flowing directly through this demand zone is the EMA 200. This long-term moving average is one of the most significant dynamic support levels in an uptrend. The confluence of a static order block with the powerful EMA 200 creates an incredibly strong support cluster. 3. Multi-Timeframe Momentum Exhaustion (The Key Timing Signal): This is the crucial timing component. While the price is dropping, our momentum dashboard reveals that sellers are becoming exhausted. MC Orderflow: The oscillator in the sub-chart is plunging towards the green "Oversold" area, signaling that the downward momentum is getting stretched. The Dashboard: This gives us a panoramic view of momentum. The 30M, 1H, and 4H timeframes are all simultaneously flashing "Oversold". This is a critical piece of information. It tells us that selling pressure is exhausted across multiple key timeframes, precisely as the price is about to hit a major support cluster. This is a classic recipe for a sharp reversal. The Potential Trade Plan Based on this powerful alignment of signals, here is a potential trade plan: Entry Zone: The support cluster between $3.60 and $3.70 is the ideal zone to look for entries. Stop Loss: A logical stop loss could be placed just below the demand zone and the EMA 200, around $3.55. A break below this level would invalidate the bullish structure. Potential Targets: Target 1: A reclaim of the Daily Open at $3.91. Target 2: The intermediate resistance and recent swing high in the $4.15 - $4.25 area. Target 3: A full retest of the major high at $4.45. Conclusion We are witnessing a textbook technical setup on SUI. The price is correcting within a confirmed uptrend and is now approaching a massive confluence of support (Order Block + EMA 200), all while multi-timeframe momentum indicators are signaling widespread seller exhaustion. This presents a compelling, high-probability case for a long position. Disclaimer: This analysis is for educational purposes only and is not financial advice. Trading cryptocurrencies involves a high level of risk. Always conduct your own research and consult with a licensed financial advisor before making any trading decisions.Price came back to take it's Bullish-FVG in 3.786 where Daily Open. Don't miss our Setups, follow and boost.
