Technical analysis by WavePoint_FX about Symbol PAXG: Buy recommendation (7/28/2025)

WavePoint_FX
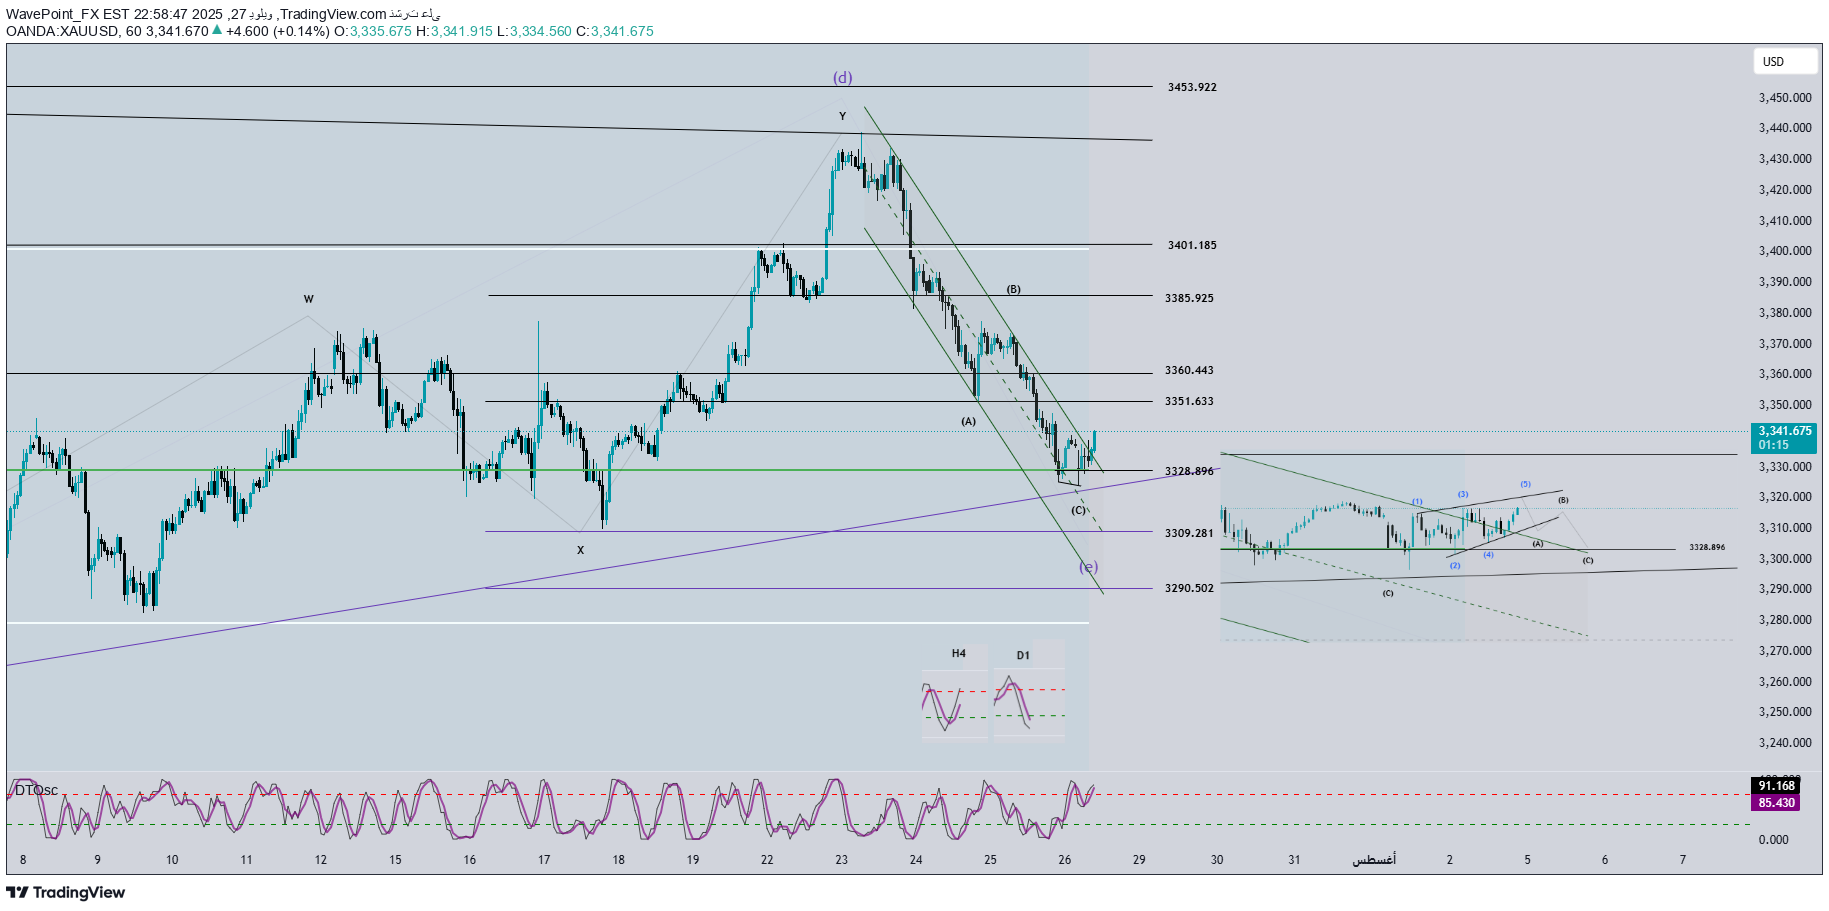
📊 ______________________________________ 🔍 A momentum analysis: • Daily time frame (D1): the indicator in the saturated saturation area, which indicates a very high possibility of a bullish reflection today. If this is achieved, we may see a rising trend or transverse movement that lasts for 4 to 5 days to come. • The time frame is 4 hours (H4): The momentum began to reflect up, which is likely to witness an upper or short fluctuation in the short term, until the momentum reaches the purchasing saturation area - which may require almost two additional H4 candles. • The time frame (H1): The indicator is currently in a purchasing saturation area, so it is expected that we will see a decline or transverse movement in the near term before confirming the reflection. ______________________________________ 🌀 Wave Structure analysis: • In the H4 chart, the previously proposed scenario is still standing: the price is moving within a ABCDE cards. Currently we are in the final E wave of this triangle. • In the H1 chart, we note that the price is moving within a price channel, and there is a clear formation of ABC corrective wave. • The bottom side of the triangle (which is indicated in the green line) with support areas constitute possible areas for the end of the wave. 🔺 Note: The wa wave is not completely having to end on the triangle rib, but it can penetrate it a little. Therefore, we also use micro -wave structures to accurately determine the reflection areas. ______________________________________ 🎯 The important price areas to be monitored: • The first goal: 3329 • The second goal: 3309 • The third goal: 3290 ______________________________________ 🔎 Small wave structure (M10): Through the graph, we notice the formation of a Leading Diagonal triangle - a model that usually appears in the first wave. If this model is confirmed, the price may witness a sharp decrease towards the 3329 region. ______________________________________ ⚖️ Integration of momentum with wave structure: • D1 frame: indicates the possibility of an upper reflection → supports the opening of purchase deals (Buy). • H4 frame: Although the momentum is upward, the price movement is still weak and has not confirmed the start of a strong rising trend → It is important to tighten the stop loss (SL). • H1 frame: with purchasing saturation and the appearance of an elementary triangular model → We expect a drop wave about 3329 (wave 2) → which is an ideal area for purchase. ______________________________________ 🧭 Trading plan: Experienced traders: → Wait for the price to reach sensitive areas, then search for reflection signals to enter. For beginners: → The following purchase orders (Limit Buy) can be adopted: The first plan: Purchase area: 3330 - 3328 • Stopping loss: 3320 • Goal 1: 3351 • Goal 2: 3370 • Termination 3: 3385 ✅ The second plan: • Buying area: 3310 - 3308 • Stopping loss: 3300 • Goal 1: 3328 • Termination 2: 3351 • target 3: 3370
