Technical analysis by WavePoint_FX about Symbol PAXG: Sell recommendation (7/25/2025)

WavePoint_FX
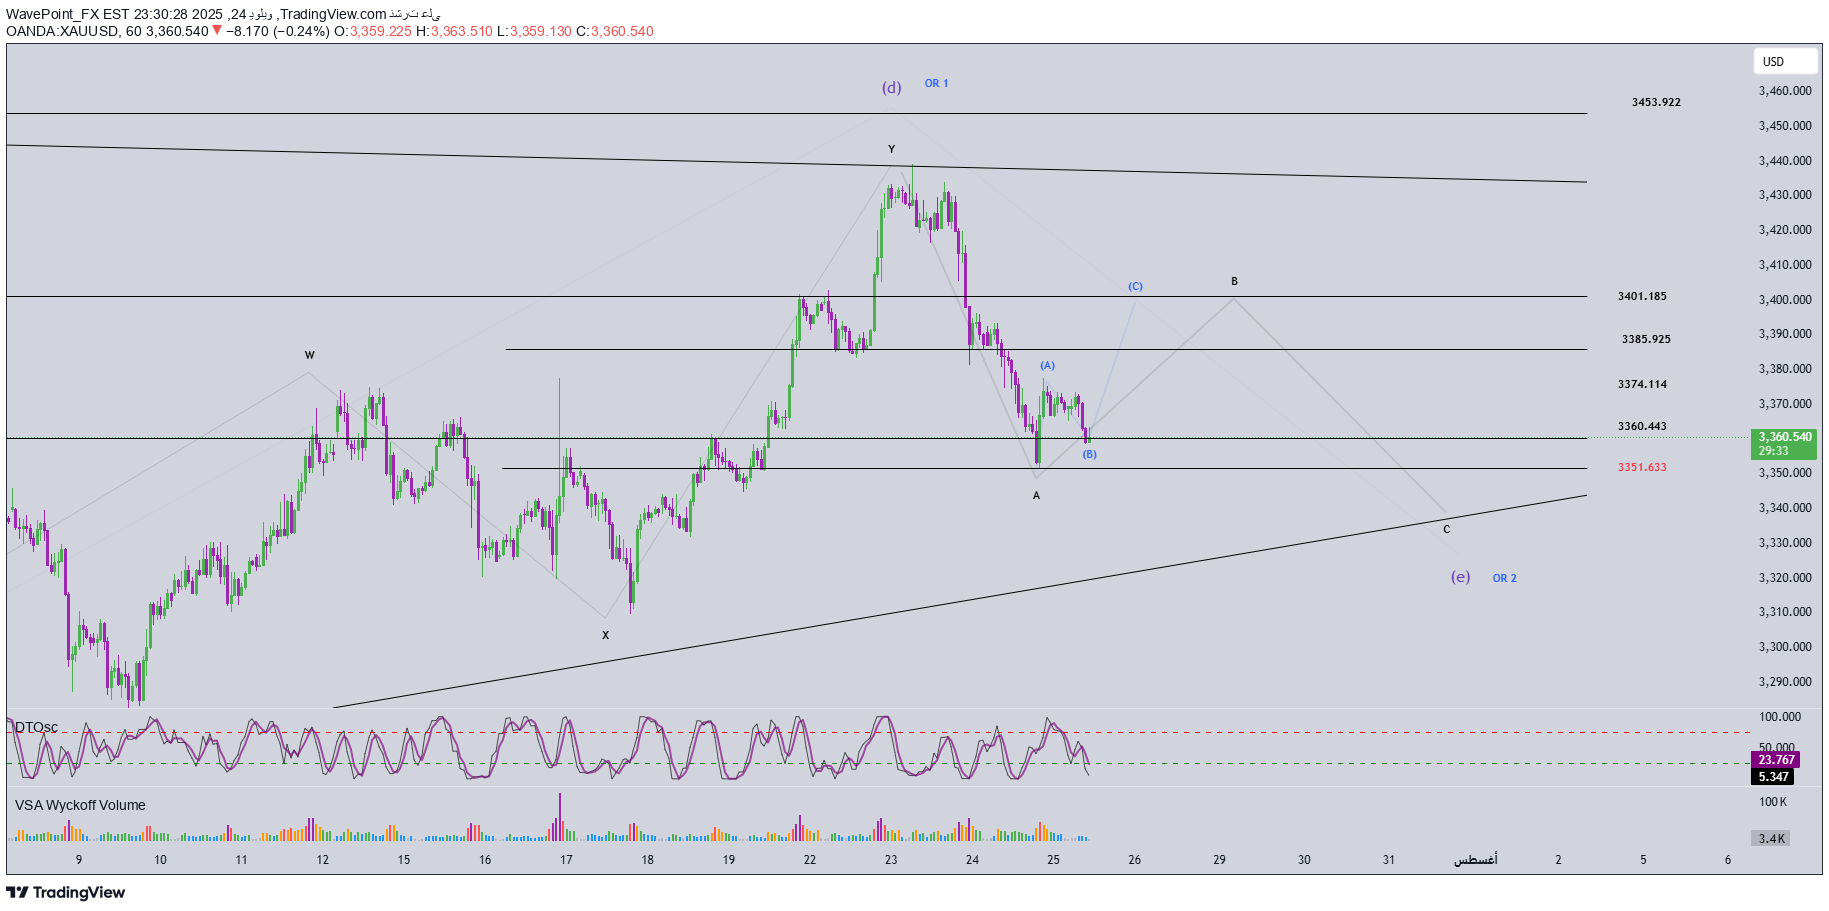
📊 🔍 The momentum analysis Daily timeline (D1): momentum in a decline. Given the current decline, it is possible that the momentum will enter the saturated area of saturation during two daily candles coming, indicating the possibility of an additional short -term drop. The time frame is 4 hours (H4): The momentum is preparing to reflect towards the landing, which is likely to witness a transverse movement or a slight decrease in the short term. The timeline one hour (H1): The momentum continues to drop, and it is expected that the saturated saturation area is expected to enter the current candle →, which may lead to a temporary budget. 🌀 Elliott waves structure A wave A (in black) was already formed according to the five -wave model, without any abnormal patterns →, therefore, it is expected that the B (black) wave is with a three -wave structure. Currently, the price moves within the wa wave (in blue), which means that the A (blue) wave has been completed. When looking at the small time frames, a five-pointed pattern appears → which supports the hypothesis that the B (black) wave takes the form of zigzag 5-3-5. The expected goal of the end of the wave (blue) is the 3360 area, a support area that also intersects with Fibonacci levels → which makes it an ideal area for a bullish bounce. If the price is bounced from the 3360 region, the COM (blue) is expected to end at 3386 or 3402 levels. However, if the price is broken 3351, this scenario becomes invalid, and we will resort to an alternative analysis based on the lower limit of the triangle (C)-(E) to determine a new purchase area. 🔄 Mensing between momentum and wave structure D1 momentum indicates a weakness in the current descending wave, and it appears that the lower limit of the triangle (C)-(E) represents an area suitable for the end of the wave. The perfect scenario will be as follows: A short -term bullish reflux simultaneously with the reflection of the H1 momentum towards ascending to complete the wa wave (blue). Then the H4 momentum reflection is followed towards the landing to confirm the reflection of the general direction. 📌 Trading plan Experienced traders: Watch the two areas of 3385 and 3401 in search of reflection signs → to enter a sale. For beginners, I recommend the following plan using suspended orders: Sell Zone: 3399 - 3402 Shuting up loss (SL): 3501 The first goal (TP1): 3374 The second goal (TP2): 3351
