Technical analysis by GoldMarketKiller about Symbol PAXG: Buy recommendation (7/24/2025)

GoldMarketKiller
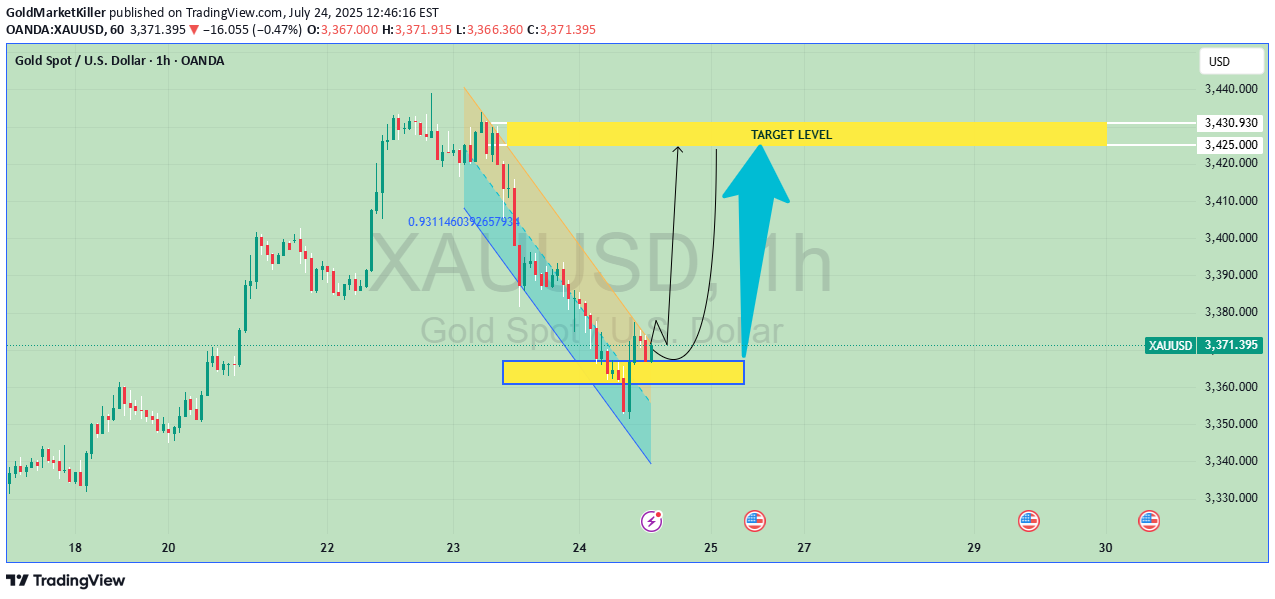
The chart you provided is a 1-hour (1h) XAU/USD (Gold/US Dollar) price chart Here's a correct and concise description of the technical analysis shown: Current Price 33,70 Chart Analysis Description: This is a 1-hour XAU/USD chart showing a bullish reversal pattern: The price previously moved in a downward trend, forming a falling wedge pattern (marked in yellow). At the bottom of the wedge, there is a support zone highlighted in yellow, where the price has shown a potential reversal. A bullish breakout is indicated, suggesting the price has broken out of the falling wedge to the upside. The Fibonacci retracement level (~0.618) is marked inside the wedge, aligning with the breakout area. A target level zone is indicated in yellow at the top (~between $2,430 and $2,440), suggesting the expected upward move after breakout. A blue upward arrow shows the projected price movement from the breakout zone to the target zone. --- Key Elements: Pattern: Falling Wedge (Bullish Reversal) Support Zone: Near $3,365 Target Zone: Around $3,430–$3,440 Timeframe: 1-hour Signal: Potential Buy on breakout confirmation Please Kindly Support with Boost and Comment i will be Glad
