Technical analysis by WavePoint_FX about Symbol PAXG: Buy recommendation (7/24/2025)

WavePoint_FX
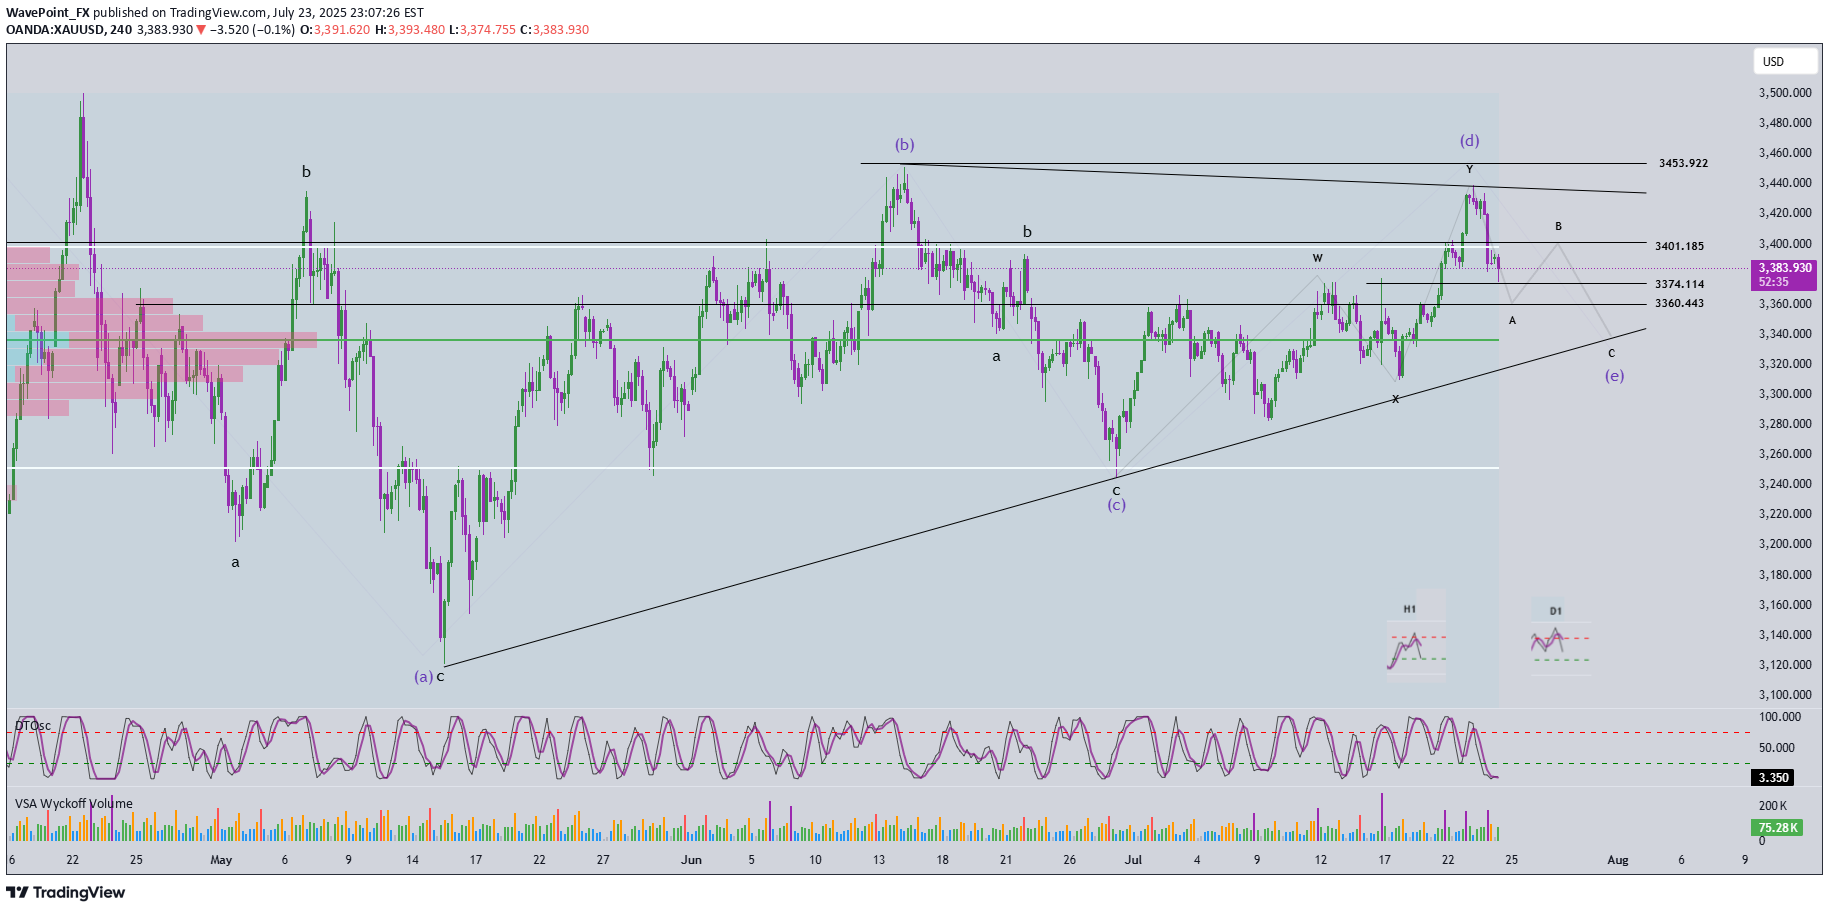
📊 ________________________________________ 🔍 Momentum Analysis: • D1 Timeframe: Momentum is currently in a downtrend, indicating that the dominant trend in the short term (at least until early next week) is likely to remain bearish or sideways. • H4 Timeframe: Momentum has entered the oversold zone and is showing signs of a potential bullish reversal. This suggests that a corrective upward move may occur today. • H1 Timeframe: Momentum is still declining and is expected to need around two more H1 candles before entering the oversold zone, implying that one more leg down may occur before a recovery begins. ________________________________________ 🌀 Elliott Wave Structure Update: Yesterday’s expectation of a breakout above the resistance zone at 3453 to confirm the start of a new bullish trend did not materialize. Instead, price dropped to the 3374 region, opening up two primary scenarios: ✅ Scenario 1: The correction is still unfolding • Wave (d) in blue appears to be complete. • The current leg is likely wave (e), the final leg in a contracting triangle correction. • In this case, the lower boundary of the triangle and overlapping support zones will serve as key levels to watch for the completion of wave (e). ✅ Scenario 2: Wave 1 of a new bullish trend has completed • The current decline is wave 2 in a new bullish impulsive sequence. • The objective here is to identify the bottom of wave 2 to prepare for a potential buy entry into wave 3, which is expected to be stronger and longer than wave 1. 📌 Key difference between the two scenarios: • Scenario 1 → Wave (e) completes, followed by wave 1 of wave 5. • Scenario 2 → Wave 2 completes, followed by a powerful wave 3 of wave 5. ________________________________________ 🧩 Current Wave Structure: • A five-wave bearish structure is currently unfolding on the chart. • According to Elliott Wave Theory, corrective patterns do not typically form five-wave structures. • Therefore, this is likely wave A in a zigzag (5-3-5) formation. • Possible targets for wave 5 within wave A: o Target 1: 3374 – current reaction zone. o Target 2: 3360 – next significant support level. ________________________________________ 📌 Combining Wave Structure with Momentum: The D1 momentum is firmly bearish, reinforcing the view that the market is undergoing a larger ABC correction. On the H4 timeframe, momentum is oversold and showing early signs of reversal, aligning with the potential formation of wave B — typically a weak, sideways upward move. The likely resistance zone for the end of wave B lies between 3401 and 3410. Meanwhile, H1 momentum is still falling and not yet in the oversold zone, suggesting there may be one more move down to complete wave 5. The ideal target for this final leg is around 3360. Summary: • D1 bearish → confirms ongoing major correction. • H4 oversold → supports a potential weak wave B. • H1 still declining → wave 5 may complete around 3360 before a recovery begins. ________________________________________ 💼 Suggested Trading Plan: For traders with limited experience or those not yet confident in reading live market signals, a Buy Limit strategy at clear support levels is recommended: • Buy Zone: 3362 – 3360 • Stop Loss: 3352 • Take Profit: o TP1: 3384 o TP2: 3400 🎯 For experienced traders, it is advised to observe price action at the target support zones and look for real-time reversal signals to optimize entry timing.📍 Price is still moving according to the previous analysis, but unfortunately, the trade was stopped out at Stop Loss. Currently, H4 momentum is showing signs of a bullish reversal, suggesting that this could be a corrective upward move as previously mentioned. Pay close attention to the 3402 resistance zone – this may be where the retracement ends and the market gives a clearer reaction.
