Technical analysis by AtresCryptoAcademy about Symbol ENA: Buy recommendation (7/23/2025)

AtresCryptoAcademy
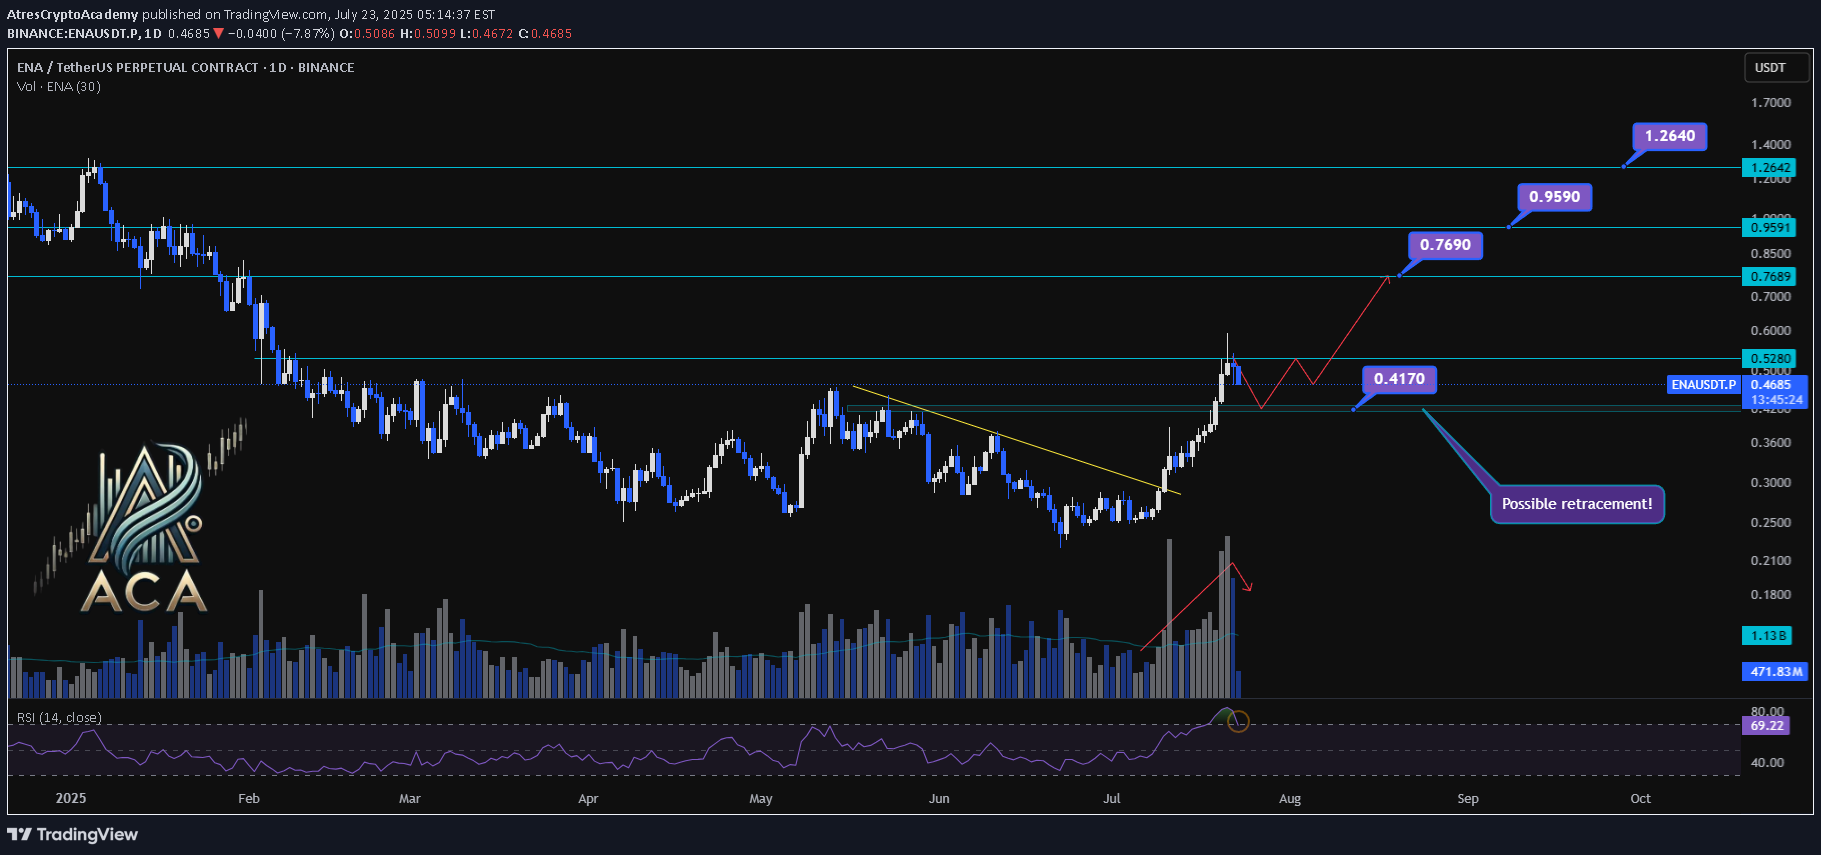
ENA/USDT Chart Analysis | Volatility Signals & Bullish Triggers 🔍 Let’s dive into the ENA/USDT perpetual contract and analyze recent price action, focusing on momentum shifts and key breakout scenarios. ⏳ Daily Overview The daily chart shows that ENA recently reentered the overbought zone on the RSI, which can serve as a potential trigger for traders watching momentum shifts. Earlier, price action broke decisively above a long-standing descending trendline, resulting in a rapid, nearly 100% surge, a classic RR2 move off the trendline. This breakout coincided with a visible uptick in trading volume, confirming strong demand behind the move. Now, during the ensuing rest or correction phase, trading volume is decreasing—often a constructive sign suggesting either profit-taking or a healthy pullback rather than panic selling. 🔺 Bullish Trigger & Setup: - RSI Signal: Reentry into the RSI overbought zone is a potential long trigger, especially if confirmed by price action. - Confirmation Level: A daily close with strong volume above $0.528 would add conviction to a bullish setup. - Trendline Reference: The break above the recent trendline fueled the rapid advance, showing the importance of watching such key resistance levels. 📊 Key Targets (on further bullish confirmation): - $0.769 — First upside resistance. - $0.959 — Next bullish target. - $1.264 — Extension target if momentum continues and broader market sentiment remains supportive. 🚨 Conclusion: Eyes are on the $0.528 level—closing above it with volume, especially while RSI holds in the overbought zone, could provide the next strong entry signal. Current declining volume during pullbacks suggests this is likely a profit-taking phase or standard correction, not bearish capitulation. Keep monitoring RSI, volume profile, and price closes for the next actionable opportunity.
