Technical analysis by GoldFxMinds about Symbol PAXG on 7/22/2025

GoldFxMinds
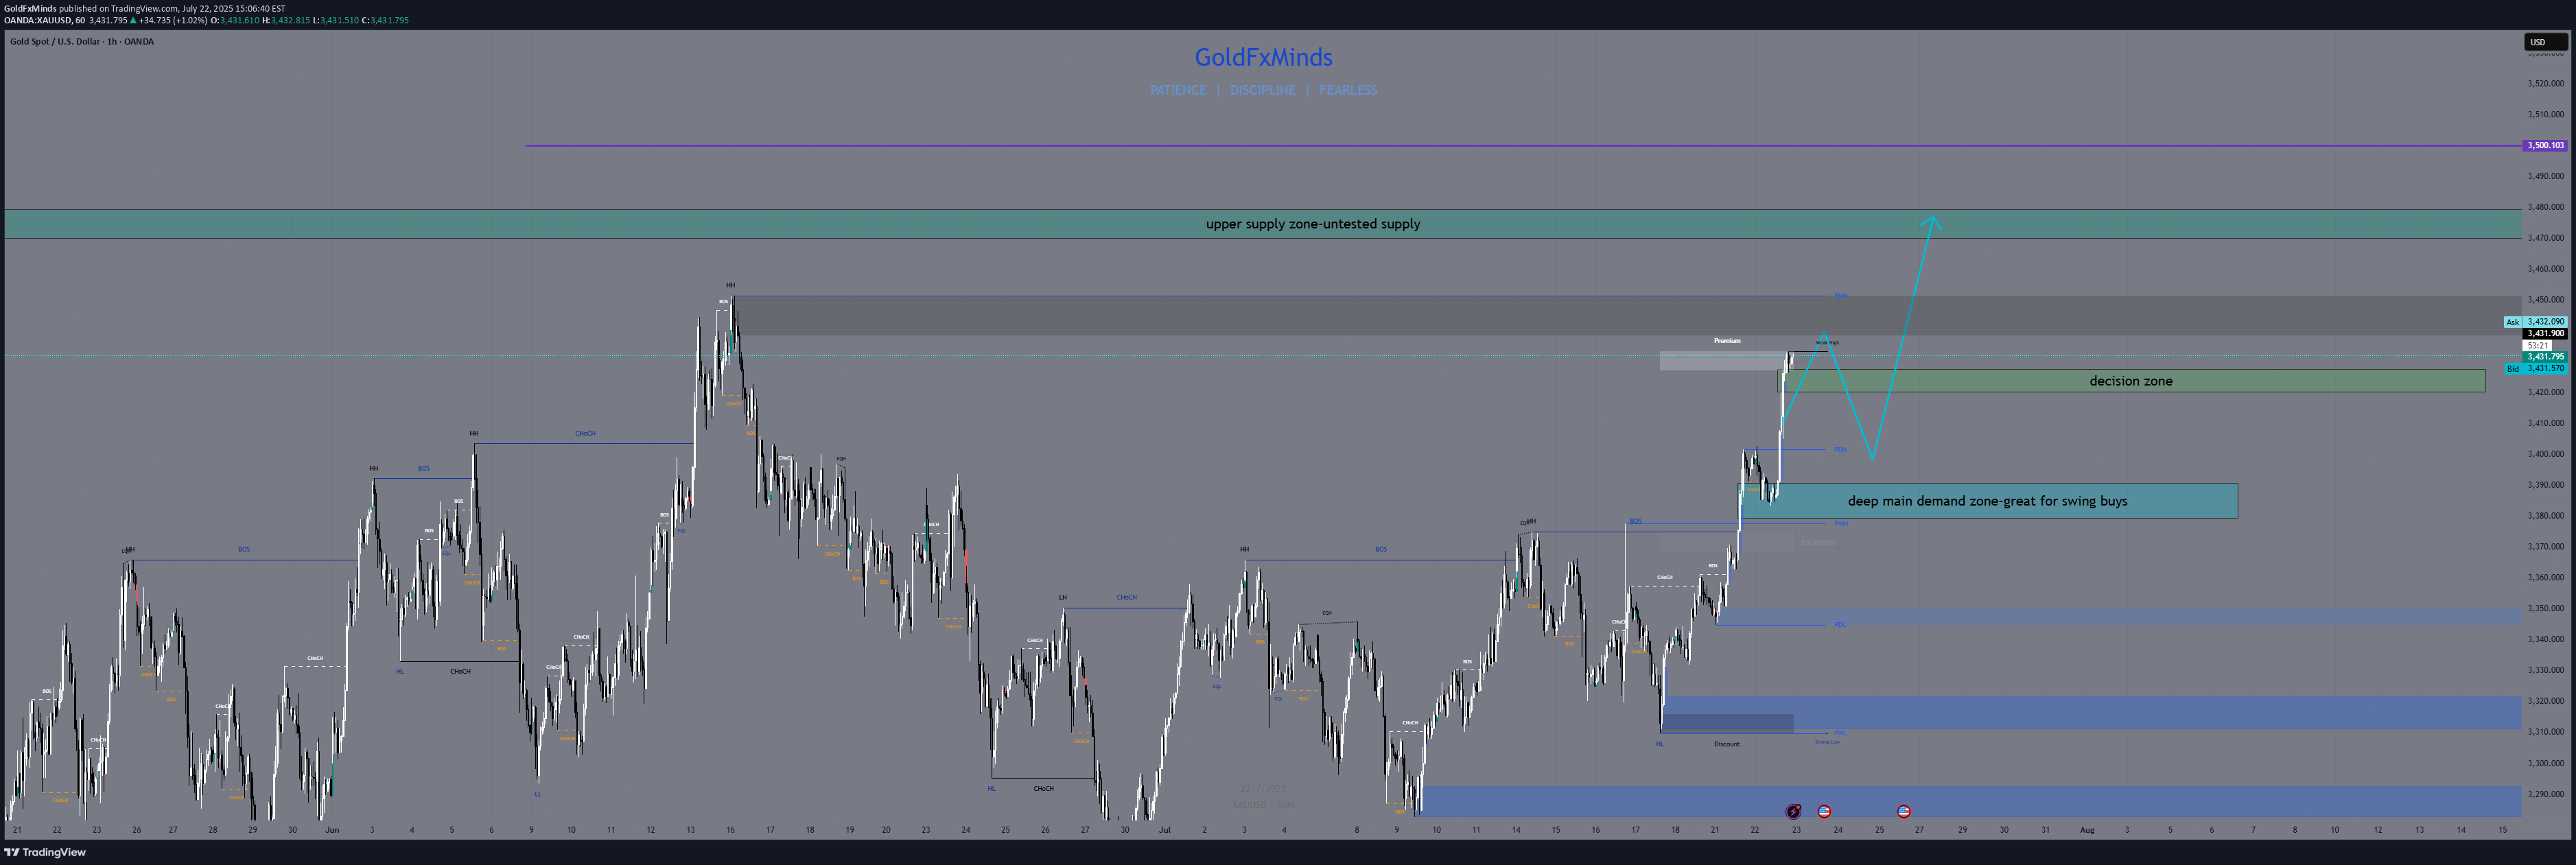
Hey gold lovers! As the NY session wraps up, the chart is a painting of tension: gold boxed tight between major structure — and the real action is only about to start. Bias: At this stage, gold remains in a short-term bullish structure as long as price holds above the 3421–3428 decision area. A break and hold below this zone would shift the bias to neutral or bearish for the next sessions. 🎨 What’s drawn on the chart? 🟥 3472–3478 Supply Zone: The ceiling, still untouched — this is where every failed breakout has left a “scar” on the chart. If we finally reach this zone, watch for wicks, rejections, or that rare, clean breakout candle. Sellers and patient bulls are both watching for “the drawing” to be complete. 🟩 3383–3390 Demand Zone: The real floor. On your chart, it’s the base built by strong bounces and those long wicks buyers left behind. If price falls here, it’s not just a line: it’s a zone where new rallies are born and the market might “paint” a major reversal. 🟦 The Middle is Just Noise Price is coiling, painting confusion in the center — but the edge zones are where structure and opportunity live. Don’t be the trader who gets erased in the chop. Let price draw the story at supply or demand before making your move. 💡 Plan for Tonight Wait for price to reach 🟥 supply or 🟩 demand. Watch the “drawing” — will you see a wick, a rejection, or a true breakout? Only trade once the story is clear at the edges. Drop your best chart art or scenario below! like🚀🚀🚀and 🔔 Follow for real structure updates & daily market stories — let’s turn trading into a masterpiece, together. GoldFxMinds
