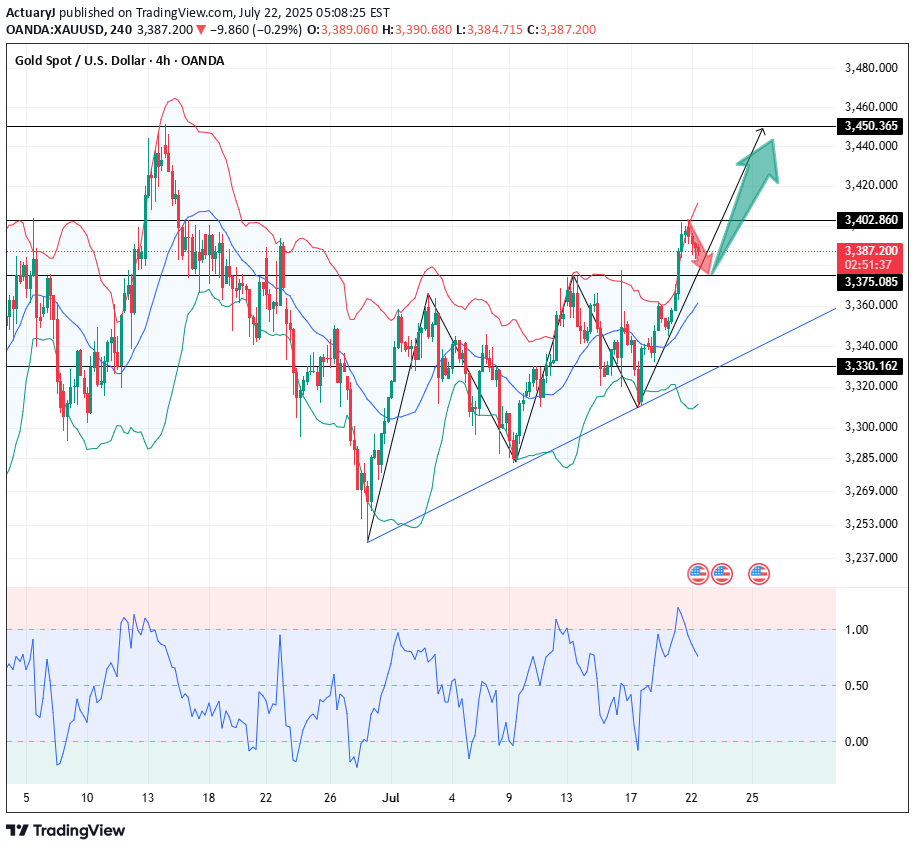
Technical analysis by ActuaryJ about Symbol PAXG: Buy recommendation (7/22/2025)

ActuaryJ

Gold technical analysis Daily chart resistance level 3450, support level 3330 Four-hour chart resistance level 3420, support level 3375 One-hour chart resistance level 3402, support level 3375. Gold rose sharply on Monday, fluctuated upward in the Asian session, and the NY market accelerated its rise, with the daily line rising sharply to 3400. The fundamentals of the bull market have not changed, and this time it is believed that the factor that triggered the unilateral rise is the expectation of the Fed's interest rate cut. Yesterday I mentioned that the 1-hour bottom structure appeared, and a new bullish opportunity appeared again! Yesterday's idea was very clear. The Asian session stepped back to confirm the top and bottom conversion support level of 3344, and finally the NY market rose sharply, directly breaking through the key position of 3377. Gold price stood firm at 3360, preparing to break through the key position of 3377 and then accelerate its rise. Yesterday's increase broke through the highest level in the past month. After all, the strength after the breakout after such a long period of volatility will not be small. In the previous few trading days, it returned to the previous high to complete the conversion of top and bottom. Today, pay attention to the support of the top and bottom conversion position of 3377. If it falls back during the day, you can continue to buy on dips based on the support of 3375. The bulls are accumulating momentum to break through the suppression of the 3400 mark. If it stands firm at 3400 after the breakthrough, it will be a large-scale increase. In terms of intraday operations, buy more near 3377/75 after the retracement. Buy: 3375 near Buy: 3402nearGo long and take profit at the support of 3375. Today's narrow range fluctuations, sell first and then buy to make a profitLatest resistance and support updates: Daily chart resistance 3450, support 3375 4-hour chart resistance 3439, support 3385 1-hour chart resistance 3430, support 3400. Pay attention to stabilization near 3400 and buy. The second is the buy point near 3385. Please use a small stop loss test. Be aware of the risk!